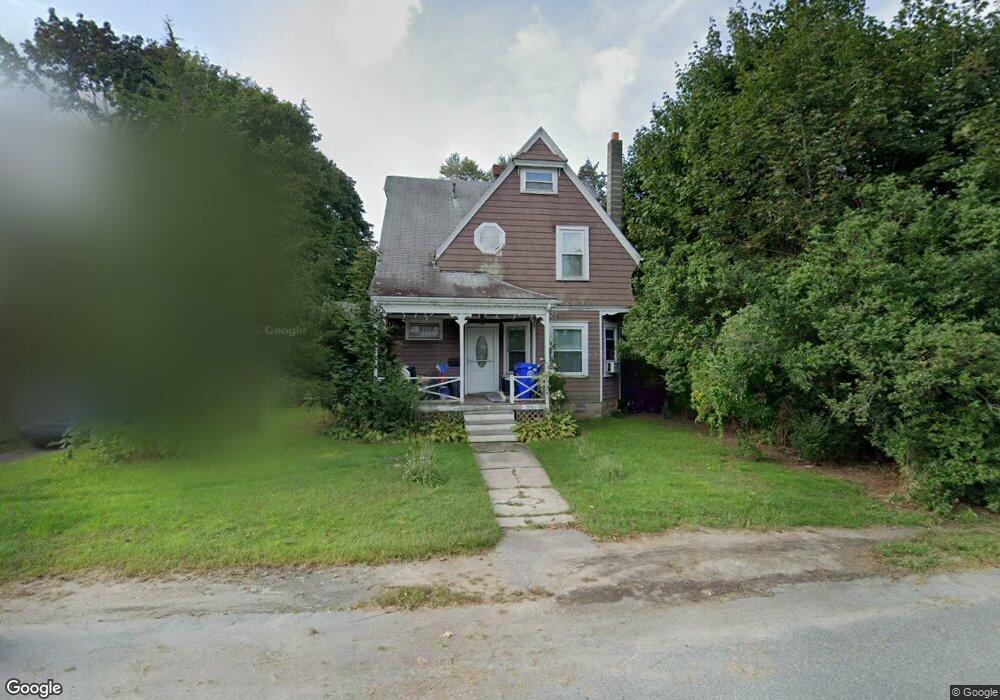
26 Upland St Holbrook, MA 02343
Estimated Value: $519,024 - $586,000
3
Beds
1
Bath
1,608
Sq Ft
$340/Sq Ft
Est. Value
About This Home
This home is located at 26 Upland St, Holbrook, MA 02343 and is currently estimated at $546,506, approximately $339 per square foot. 26 Upland St is a home located in Norfolk County with nearby schools including John F. Kennedy Elementary School, Holbrook Middle High School, and Boston Higashi School.
Ownership History
Date
Name
Owned For
Owner Type
Purchase Details
Closed on
Nov 30, 2007
Sold by
Briggs Clifford M and Briggs Melissa L
Bought by
Belezos Lori and Belezos William
Current Estimated Value
Home Financials for this Owner
Home Financials are based on the most recent Mortgage that was taken out on this home.
Original Mortgage
$248,000
Outstanding Balance
$157,007
Interest Rate
6.48%
Mortgage Type
Purchase Money Mortgage
Estimated Equity
$389,499
Purchase Details
Closed on
Apr 1, 2004
Sold by
Briggs Clifford M
Bought by
Briggs Clifford M and Briggs Melissa L
Home Financials for this Owner
Home Financials are based on the most recent Mortgage that was taken out on this home.
Original Mortgage
$134,500
Interest Rate
5.56%
Mortgage Type
Purchase Money Mortgage
Create a Home Valuation Report for This Property
The Home Valuation Report is an in-depth analysis detailing your home's value as well as a comparison with similar homes in the area
Home Values in the Area
Average Home Value in this Area
Purchase History
| Date | Buyer | Sale Price | Title Company |
|---|---|---|---|
| Belezos Lori | $298,000 | -- | |
| Belezos Lori | $298,000 | -- | |
| Belezos Lori | $298,000 | -- | |
| Briggs Clifford M | -- | -- | |
| Briggs Clifford M | -- | -- | |
| Briggs Clifford M | -- | -- |
Source: Public Records
Mortgage History
| Date | Status | Borrower | Loan Amount |
|---|---|---|---|
| Open | Belezos Lori | $248,000 | |
| Closed | Belezos Lori | $248,000 | |
| Previous Owner | Briggs Clifford M | $134,500 |
Source: Public Records
Tax History
| Year | Tax Paid | Tax Assessment Tax Assessment Total Assessment is a certain percentage of the fair market value that is determined by local assessors to be the total taxable value of land and additions on the property. | Land | Improvement |
|---|---|---|---|---|
| 2025 | $61 | $465,300 | $251,700 | $213,600 |
| 2024 | $5,709 | $424,800 | $228,800 | $196,000 |
| 2023 | $6,047 | $393,200 | $208,000 | $185,200 |
| 2022 | $5,679 | $344,400 | $180,800 | $163,600 |
| 2021 | $5,562 | $323,000 | $169,000 | $154,000 |
| 2020 | $5,654 | $307,800 | $159,800 | $148,000 |
| 2019 | $5,684 | $292,100 | $147,700 | $144,400 |
| 2018 | $5,517 | $266,900 | $127,300 | $139,600 |
| 2017 | $5,428 | $259,700 | $127,300 | $132,400 |
| 2016 | $4,639 | $236,200 | $114,600 | $121,600 |
| 2015 | $4,329 | $226,900 | $110,000 | $116,900 |
| 2014 | $4,259 | $226,900 | $110,000 | $116,900 |
Source: Public Records
Map
Nearby Homes
- 12 Hamilton Way
- 14 Leonard Ln
- 719 S Franklin St Unit C Block 1
- 660 S Franklin St
- 275 Jon Dr
- 52 Quincy St
- 36 Kalmia Rd
- 610 S Franklin St Unit F102
- 244 Hovendon Ave
- 170 Elsie Rd
- 19 Rodwell St
- 37 Reeds Ln
- 109 Lester Rd
- 30 Aspen St
- 193 E Spring St
- 133 Ardsley Cir
- 191 E Spring St
- 192 E Spring St
- 27 Valley Rd
- 51 Oscar Ave
Your Personal Tour Guide
Ask me questions while you tour the home.