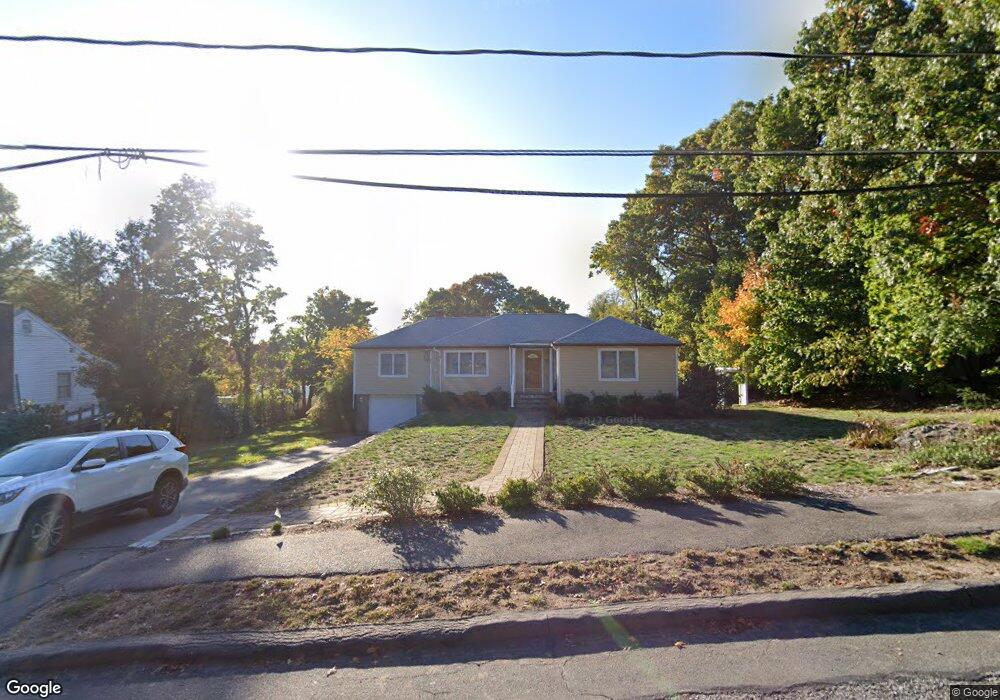
26 Vale View Rd Wakefield, MA 01880
West Side NeighborhoodEstimated Value: $716,000 - $809,000
3
Beds
1
Bath
1,208
Sq Ft
$637/Sq Ft
Est. Value
About This Home
This home is located at 26 Vale View Rd, Wakefield, MA 01880 and is currently estimated at $770,024, approximately $637 per square foot. 26 Vale View Rd is a home located in Middlesex County with nearby schools including Wakefield Memorial High School, St Joseph School, and St. Patrick Elementary School.
Create a Home Valuation Report for This Property
The Home Valuation Report is an in-depth analysis detailing your home's value as well as a comparison with similar homes in the area
Home Values in the Area
Average Home Value in this Area
Tax History
We collect this data history from publicly available records. To have your information removed, we recommend requesting removal directly through your county’s website.
| Year | Tax Paid | Tax Assessment Tax Assessment Total Assessment is a certain percentage of the fair market value that is determined by local assessors to be the total taxable value of land and additions on the property. | Land | Improvement |
|---|---|---|---|---|
| 2025 | $7,485 | $659,500 | $417,800 | $241,700 |
| 2024 | $7,202 | $640,200 | $405,600 | $234,600 |
| 2023 | $6,954 | $592,800 | $375,500 | $217,300 |
| 2022 | $6,639 | $538,900 | $341,400 | $197,500 |
| 2021 | $6,355 | $499,200 | $318,700 | $180,500 |
| 2020 | $6,110 | $478,500 | $305,500 | $173,000 |
| 2019 | $5,927 | $462,000 | $295,000 | $167,000 |
| 2018 | $5,609 | $433,100 | $276,500 | $156,600 |
| 2017 | $5,375 | $412,500 | $263,400 | $149,100 |
| 2016 | $5,256 | $389,600 | $244,400 | $145,200 |
| 2015 | $4,909 | $364,200 | $228,500 | $135,700 |
| 2014 | $4,510 | $352,900 | $221,400 | $131,500 |
Source: Public Records
Map
Nearby Homes
- 131 Prospect St
- 31 Morrison Ave
- 24 Bellevue Rd
- 13 Parker Rd
- 2 Summit Dr Unit 41
- ONE Summit Dr Unit 57
- 71 Converse St
- 3 Summit Dr Unit 17
- 713 Gazebo Cir Unit 713
- 116 Parker Rd
- 47 Winship Dr
- 64 Main St Unit 45B
- 64 Main St Unit 21B
- 66 Main St Unit 26A
- 66 Main St Unit 11A
- 62 High St Unit Lot 8
- 62 Abigail Way Unit 1006
- 62 Abigail Way Unit 4006
- 62 Abigail Way Unit 4007
- 3 Walnut St
Your Personal Tour Guide
Ask me questions while you tour the home.