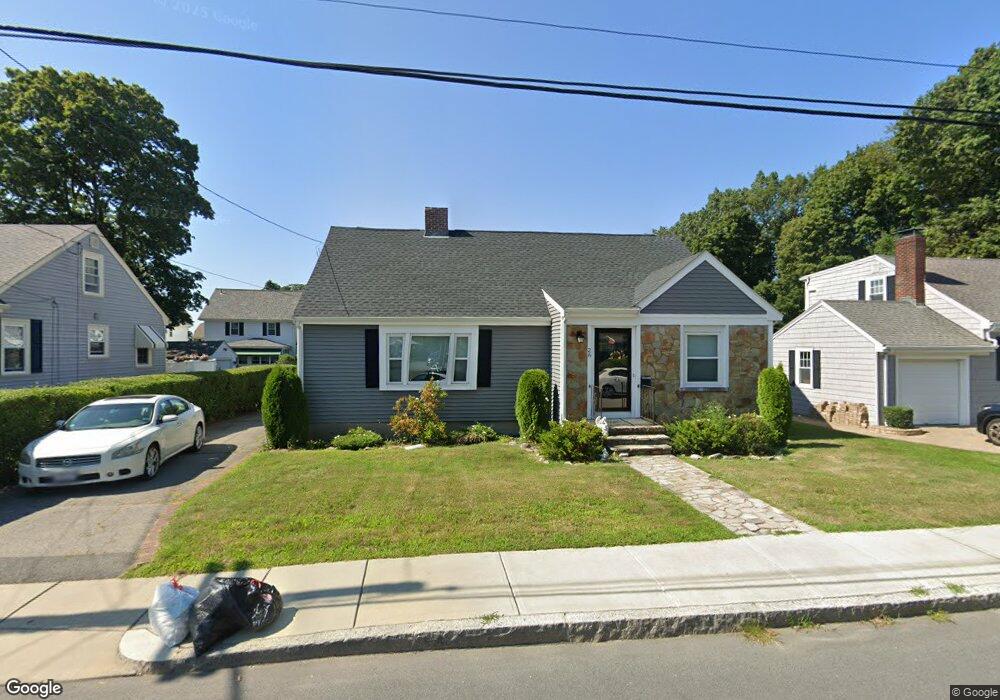
26 Viden Rd Quincy, MA 02169
South Quincy NeighborhoodEstimated Value: $792,000 - $882,000
4
Beds
2
Baths
2,032
Sq Ft
$412/Sq Ft
Est. Value
About This Home
This home is located at 26 Viden Rd, Quincy, MA 02169 and is currently estimated at $837,049, approximately $411 per square foot. 26 Viden Rd is a home located in Norfolk County with nearby schools including Lincoln-Hancock Community School, South West Middle School, and Quincy High School.
Ownership History
Date
Name
Owned For
Owner Type
Purchase Details
Closed on
Nov 23, 2022
Sold by
Sullivan Steven A and Sullivan Lorraine T
Bought by
Sullivan Richard A
Current Estimated Value
Purchase Details
Closed on
Jan 4, 1989
Sold by
Hancock Lillianr
Bought by
Sullivan Steven A
Home Financials for this Owner
Home Financials are based on the most recent Mortgage that was taken out on this home.
Original Mortgage
$154,800
Interest Rate
10.32%
Mortgage Type
Purchase Money Mortgage
Create a Home Valuation Report for This Property
The Home Valuation Report is an in-depth analysis detailing your home's value as well as a comparison with similar homes in the area
Home Values in the Area
Average Home Value in this Area
Purchase History
| Date | Buyer | Sale Price | Title Company |
|---|---|---|---|
| Sullivan Richard A | -- | None Available | |
| Sullivan Steven A | $172,000 | -- |
Source: Public Records
Mortgage History
| Date | Status | Borrower | Loan Amount |
|---|---|---|---|
| Previous Owner | Sullivan Steven A | $144,000 | |
| Previous Owner | Sullivan Steven A | $154,800 |
Source: Public Records
Tax History Compared to Growth
Tax History
| Year | Tax Paid | Tax Assessment Tax Assessment Total Assessment is a certain percentage of the fair market value that is determined by local assessors to be the total taxable value of land and additions on the property. | Land | Improvement |
|---|---|---|---|---|
| 2025 | $8,066 | $699,600 | $347,100 | $352,500 |
| 2024 | $7,664 | $680,000 | $330,600 | $349,400 |
| 2023 | $6,976 | $626,800 | $300,500 | $326,300 |
| 2022 | $6,618 | $552,400 | $229,500 | $322,900 |
| 2021 | $6,559 | $540,300 | $229,500 | $310,800 |
| 2020 | $6,740 | $542,200 | $229,500 | $312,700 |
| 2019 | $6,166 | $491,300 | $216,500 | $274,800 |
| 2018 | $6,288 | $471,400 | $191,400 | $280,000 |
| 2017 | $6,061 | $427,700 | $191,000 | $236,700 |
| 2016 | $5,480 | $381,600 | $163,000 | $218,600 |
| 2015 | $5,436 | $372,300 | $163,000 | $209,300 |
| 2014 | $5,115 | $344,200 | $166,000 | $178,200 |
Source: Public Records
Map
Nearby Homes
- 155 Kendrick Ave Unit T7
- 83 Madison Ave
- 102 Conrad St
- 10 Hughes St
- 106 Home Park Rd
- 166 Phipps St
- 25 John Paul Cir
- 11 Rogers Cir
- 72 Federal Ave
- 218 Independence Ave Unit B
- 54 Elmlawn Rd
- 195 Independence Ave Unit 137
- 161 Cedar St
- 9 Independence Ave Unit 212
- 23 Bower Rd
- 5 Pearl St
- 57 Summer St
- 8 Jackson St Unit B2
- 200 Falls Blvd Unit G110
- 200 Falls Blvd Unit F206