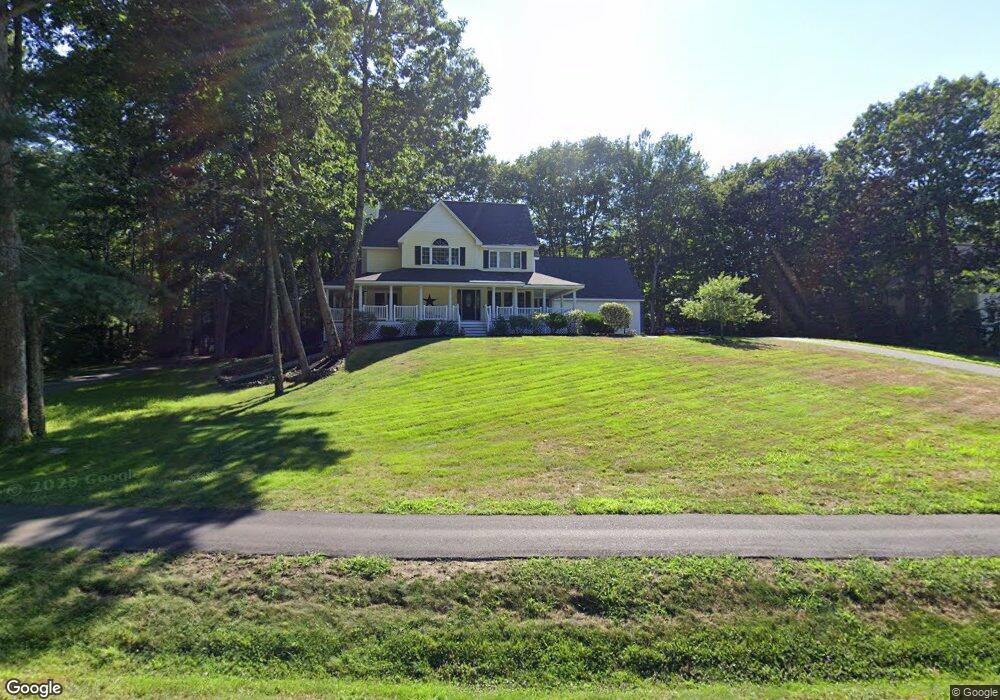
26 Vines Rd Saco, ME 04072
East Saco NeighborhoodEstimated Value: $968,000 - $1,094,000
3
Beds
3
Baths
2,287
Sq Ft
$456/Sq Ft
Est. Value
About This Home
This home is located at 26 Vines Rd, Saco, ME 04072 and is currently estimated at $1,042,589, approximately $455 per square foot. 26 Vines Rd is a home located in York County with nearby schools including C K Burns School, Saco Middle School, and Florence Lombard Christian School.
Ownership History
Date
Name
Owned For
Owner Type
Purchase Details
Closed on
Sep 14, 2020
Sold by
Armstrong Dale L and Armstrong Melissa E
Bought by
Dameli T
Current Estimated Value
Home Financials for this Owner
Home Financials are based on the most recent Mortgage that was taken out on this home.
Original Mortgage
$188,750
Interest Rate
2.9%
Mortgage Type
New Conventional
Purchase Details
Closed on
Nov 19, 2012
Sold by
Armstrong Melissa E and Armstrong Dale L
Bought by
Dameli T
Purchase Details
Closed on
Dec 21, 2007
Sold by
Bermas Honnie R and Branstetter Kenneth L
Bought by
Armstrong Melissa E and Armstrong Dale L
Home Financials for this Owner
Home Financials are based on the most recent Mortgage that was taken out on this home.
Original Mortgage
$250,000
Interest Rate
6.3%
Mortgage Type
Unknown
Create a Home Valuation Report for This Property
The Home Valuation Report is an in-depth analysis detailing your home's value as well as a comparison with similar homes in the area
Home Values in the Area
Average Home Value in this Area
Purchase History
| Date | Buyer | Sale Price | Title Company |
|---|---|---|---|
| Dameli T | -- | None Available | |
| Armstrong Dale L | -- | None Available | |
| Dameli T | -- | -- | |
| Armstrong Melissa E | -- | -- |
Source: Public Records
Mortgage History
| Date | Status | Borrower | Loan Amount |
|---|---|---|---|
| Previous Owner | Armstrong Dale L | $188,750 | |
| Previous Owner | Armstrong Melissa E | $249,900 | |
| Previous Owner | Armstrong Melissa E | $250,000 |
Source: Public Records
Tax History Compared to Growth
Tax History
| Year | Tax Paid | Tax Assessment Tax Assessment Total Assessment is a certain percentage of the fair market value that is determined by local assessors to be the total taxable value of land and additions on the property. | Land | Improvement |
|---|---|---|---|---|
| 2024 | $11,053 | $786,700 | $185,300 | $601,400 |
| 2023 | $10,375 | $703,400 | $185,300 | $518,100 |
| 2022 | $9,170 | $500,300 | $141,200 | $359,100 |
| 2021 | $8,891 | $470,900 | $129,500 | $341,400 |
| 2020 | $8,246 | $419,200 | $117,500 | $301,700 |
| 2019 | $8,124 | $419,200 | $117,500 | $301,700 |
| 2018 | $7,971 | $411,300 | $109,600 | $301,700 |
| 2017 | $7,866 | $405,900 | $99,800 | $306,100 |
| 2016 | $7,337 | $377,800 | $98,500 | $279,300 |
| 2015 | $7,052 | $366,900 | $98,500 | $268,400 |
| 2014 | $6,791 | $364,700 | $96,300 | $268,400 |
| 2013 | $6,776 | $364,700 | $96,300 | $268,400 |
Source: Public Records
Map
Nearby Homes
- 30 Vines Rd
- 57 Plymouth Dr
- TBD 530 Ferry Rd
- 5 Blaine Rd Unit 101
- 5 Blaine Rd Unit 104
- 5 Blaine Rd Unit 102
- 5 Blaine Rd
- 5 Blaine Rd Unit 103
- 19 Ocean Greens Dr
- 26 Ocean Greens Dr
- 17 Randall Ave
- 6 Tide Water Dr
- 378 Pool St
- 353 Pool St
- 625,650 Pool St
- 10 Seaside Ave
- 2 Breakwater Way Unit 2
- 27 Sunrise Ave
- part of 31 Sokokis Rd
- 343 Pool St