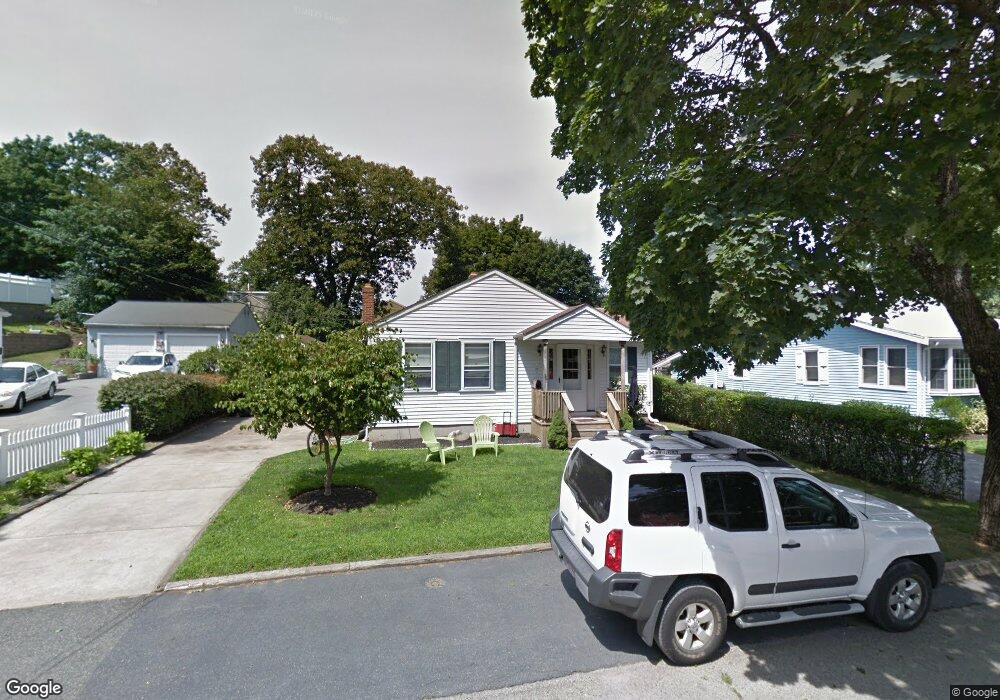
26 Volusia Rd Hingham, MA 02043
Estimated Value: $514,000 - $659,000
2
Beds
1
Bath
1,260
Sq Ft
$457/Sq Ft
Est. Value
About This Home
This home is located at 26 Volusia Rd, Hingham, MA 02043 and is currently estimated at $575,198, approximately $456 per square foot. 26 Volusia Rd is a home located in Plymouth County with nearby schools including Abigail Adams Middle School, Weymouth Middle School Chapman, and Weymouth High School.
Ownership History
Date
Name
Owned For
Owner Type
Purchase Details
Closed on
Jun 4, 2021
Sold by
Hagerty David A and Hagerty Patricia E
Bought by
Hagerty Anthony D and Gonzalez-Hagerty Gabriela
Current Estimated Value
Home Financials for this Owner
Home Financials are based on the most recent Mortgage that was taken out on this home.
Original Mortgage
$328,000
Outstanding Balance
$296,963
Interest Rate
2.9%
Mortgage Type
Purchase Money Mortgage
Estimated Equity
$278,235
Purchase Details
Closed on
May 11, 2005
Sold by
Mcintyre Michael D and Mcintyre Barbara L
Bought by
Hagerty David A and Hagerty Patricia E
Home Financials for this Owner
Home Financials are based on the most recent Mortgage that was taken out on this home.
Original Mortgage
$268,000
Interest Rate
6.05%
Mortgage Type
Purchase Money Mortgage
Create a Home Valuation Report for This Property
The Home Valuation Report is an in-depth analysis detailing your home's value as well as a comparison with similar homes in the area
Purchase History
We collect this data history from publicly available records. To have your information removed, we recommend requesting removal directly through your county’s website.
| Date | Buyer | Sale Price | Title Company |
|---|---|---|---|
| Hagerty Anthony D | $410,000 | None Available | |
| Hagerty David A | $335,000 | -- |
Source: Public Records
Mortgage History
We collect this data history from publicly available records. To have your information removed, we recommend requesting removal directly through your county’s website.
| Date | Status | Borrower | Loan Amount |
|---|---|---|---|
| Open | Hagerty Anthony D | $328,000 | |
| Previous Owner | Hagerty David A | $285,200 | |
| Previous Owner | Hagerty David A | $268,000 | |
| Previous Owner | Hagerty David A | $20,000 | |
| Previous Owner | Hagerty David A | $70,000 |
Source: Public Records
Tax History
| Year | Tax Paid | Tax Assessment Tax Assessment Total Assessment is a certain percentage of the fair market value that is determined by local assessors to be the total taxable value of land and additions on the property. | Land | Improvement |
|---|---|---|---|---|
| 2025 | $5,080 | $475,200 | $279,700 | $195,500 |
| 2024 | $4,847 | $446,700 | $279,700 | $167,000 |
| 2023 | $4,218 | $421,800 | $259,700 | $162,100 |
| 2022 | $4,246 | $367,300 | $226,400 | $140,900 |
| 2021 | $4,071 | $345,000 | $226,400 | $118,600 |
| 2020 | $3,978 | $345,000 | $226,400 | $118,600 |
| 2019 | $3,987 | $337,600 | $226,400 | $111,200 |
| 2018 | $3,652 | $310,300 | $216,500 | $93,800 |
| 2017 | $2,974 | $242,800 | $168,800 | $74,000 |
| 2016 | $3,084 | $246,900 | $160,700 | $86,200 |
| 2015 | $2,998 | $239,300 | $153,100 | $86,200 |
Source: Public Records
Map
Nearby Homes
- 30 Manatee Rd
- 21 French St
- 1429 Pleasant St
- 10 Autumn Cir
- 156 Fort Hill St
- 485 East St
- 84 Madison St
- 10-12 Drew Ave
- 203 High St
- 1297 Pleasant St
- 2 Berkley Cir
- 106 Fort Hill St
- 30 Puritan Rd
- 47 Black Rock Dr
- 1 Brewer Way
- 15 Village Rd
- 30 Franklin Rodgers Rd
- 575 Broad St Unit 312
- 140 Middle St
- 14 Black Rock Dr
Your Personal Tour Guide
Ask me questions while you tour the home.