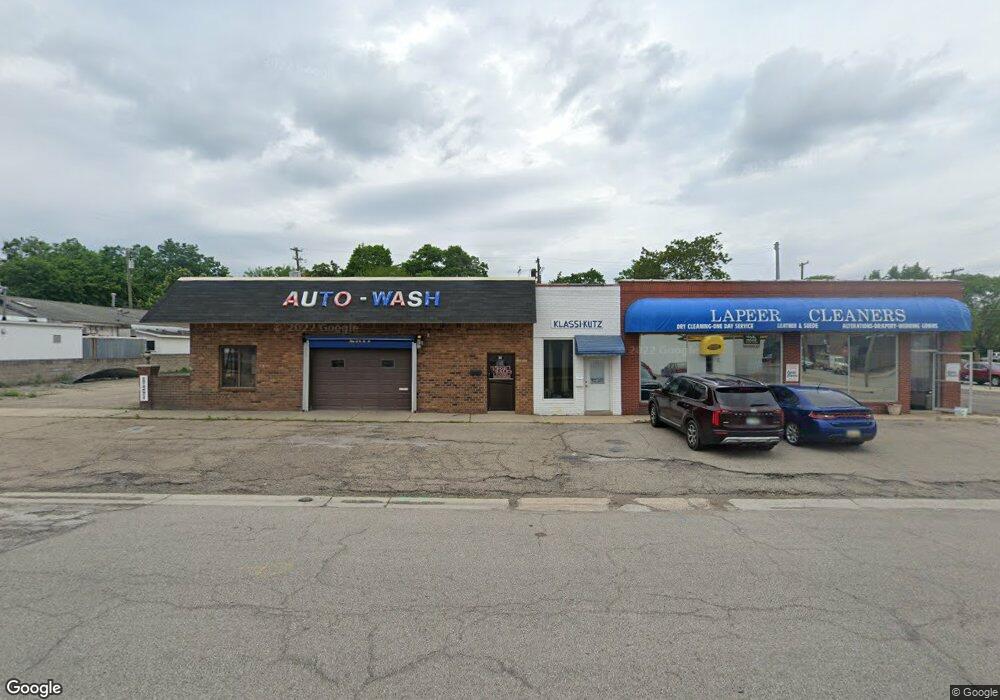
26 W Park St Lapeer, MI 48446
Estimated Value: $196,748
--
Bed
--
Bath
3,536
Sq Ft
$56/Sq Ft
Est. Value
About This Home
This home is located at 26 W Park St, Lapeer, MI 48446 and is currently estimated at $196,748, approximately $55 per square foot. 26 W Park St is a home located in Lapeer County with nearby schools including C.K. Schickler Elementary School, Rolland-Warner Middle School, and Lapeer High School.
Ownership History
Date
Name
Owned For
Owner Type
Purchase Details
Closed on
Jan 24, 2024
Sold by
Finkbeiner Dccbj Llc
Bought by
Lapeer Auto Wash Llc
Current Estimated Value
Purchase Details
Closed on
Oct 28, 2010
Sold by
Wasniowski Frank T and Wasniowski Barbara
Bought by
Finkbeiner Dccbj Llc
Home Financials for this Owner
Home Financials are based on the most recent Mortgage that was taken out on this home.
Original Mortgage
$72,000
Outstanding Balance
$47,746
Interest Rate
4.37%
Mortgage Type
Commercial
Estimated Equity
$149,002
Purchase Details
Closed on
May 19, 2010
Sold by
Dixon Gary H
Bought by
Wasniioski Frank T and Wasniowski Barbara
Purchase Details
Closed on
Mar 26, 2010
Sold by
Lane Lynda J
Bought by
Wasniowski Frank T and Wasniowski Barbara
Purchase Details
Closed on
Jun 23, 2004
Sold by
Wasniowski Frank and Wasniowski Barbara
Bought by
Lane Lynda
Purchase Details
Closed on
Aug 3, 2001
Sold by
Wolff Craig S
Bought by
Wasniowski Frank T
Purchase Details
Closed on
Dec 15, 1986
Create a Home Valuation Report for This Property
The Home Valuation Report is an in-depth analysis detailing your home's value as well as a comparison with similar homes in the area
Home Values in the Area
Average Home Value in this Area
Purchase History
| Date | Buyer | Sale Price | Title Company |
|---|---|---|---|
| Lapeer Auto Wash Llc | -- | None Listed On Document | |
| Finkbeiner Dccbj Llc | $85,000 | -- | |
| Wasniioski Frank T | -- | -- | |
| Wasniowski Frank T | -- | -- | |
| Lane Lynda | $250,000 | -- | |
| Wasniowski Frank T | $500 | -- | |
| -- | -- | -- |
Source: Public Records
Mortgage History
| Date | Status | Borrower | Loan Amount |
|---|---|---|---|
| Open | Finkbeiner Dccbj Llc | $72,000 |
Source: Public Records
Tax History Compared to Growth
Tax History
| Year | Tax Paid | Tax Assessment Tax Assessment Total Assessment is a certain percentage of the fair market value that is determined by local assessors to be the total taxable value of land and additions on the property. | Land | Improvement |
|---|---|---|---|---|
| 2025 | $3,044 | $82,700 | $0 | $0 |
| 2024 | $1,253 | $65,700 | $0 | $0 |
| 2023 | $1,195 | $60,900 | $0 | $0 |
| 2022 | $2,814 | $59,200 | $0 | $0 |
| 2021 | $3,303 | $71,400 | $0 | $0 |
| 2020 | $3,462 | $76,000 | $0 | $0 |
| 2019 | $3,456 | $73,300 | $0 | $0 |
| 2018 | $3,772 | $81,100 | $31,100 | $50,000 |
| 2017 | $3,697 | $82,400 | $0 | $0 |
| 2016 | $3,670 | $84,700 | $31,100 | $53,600 |
| 2015 | -- | $80,800 | $31,100 | $49,700 |
| 2014 | -- | $76,200 | $31,100 | $45,100 |
| 2013 | -- | $79,600 | $31,100 | $48,500 |
Source: Public Records
Map
Nearby Homes
- 745 N Calhoun St
- 215 Mason St
- 47 Pope St
- 116 W Genesee St
- 706 N Main St
- 210 N Saginaw St
- 417 E Oregon St
- 336 Raven St
- 215 Raven St
- 847 N Main St
- 835 N Main St
- 339 N Main St
- 1111 W Park St
- 1120 W Oregon St
- 350 N Jackson St
- 0000 Imlay City Rd
- 0 N Lapeer Rd Unit 50132752
- 323 Turrill Ave
- 1227 N Jackson St
- 37 S Jackson St