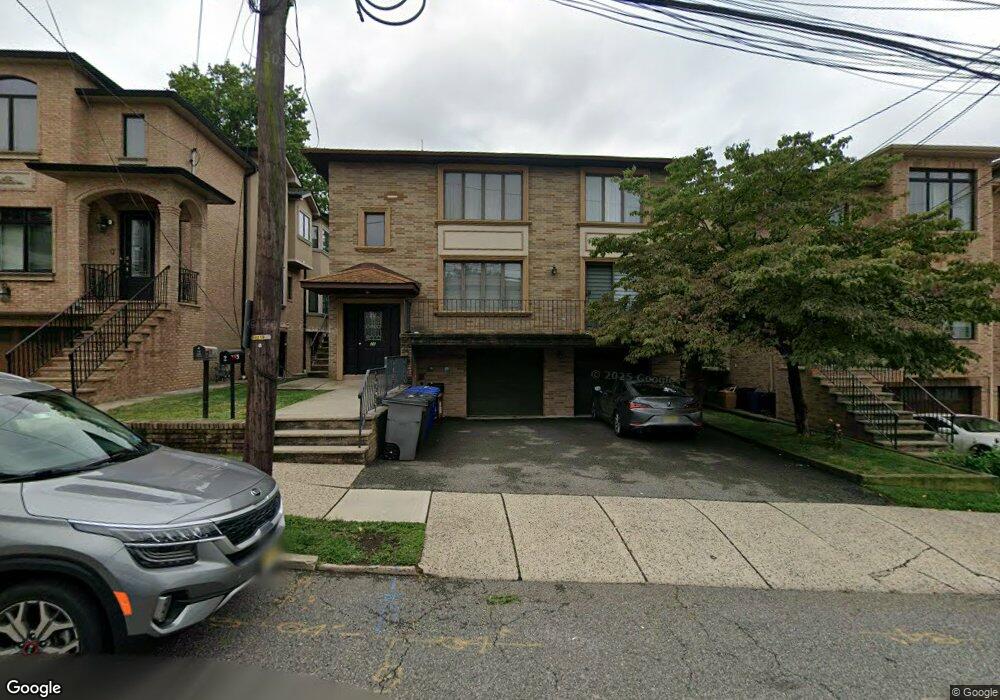
26 W Ruby Ave Unit 2fl Palisades Park, NJ 07650
Estimated Value: $1,303,000 - $1,715,000
3
Beds
2
Baths
3,264
Sq Ft
$462/Sq Ft
Est. Value
About This Home
This home is located at 26 W Ruby Ave Unit 2fl, Palisades Park, NJ 07650 and is currently estimated at $1,507,764, approximately $461 per square foot. 26 W Ruby Ave Unit 2fl is a home located in Bergen County with nearby schools including Lindbergh Elementary School, Palisades Park Jr Sr High School, and Notre Dame Academy.
Ownership History
Date
Name
Owned For
Owner Type
Purchase Details
Closed on
Dec 1, 2020
Sold by
Park Sun Bong and Kim Mihee
Bought by
Kim Daniel D and Kim Jong Rye
Current Estimated Value
Home Financials for this Owner
Home Financials are based on the most recent Mortgage that was taken out on this home.
Original Mortgage
$825,000
Interest Rate
2.6%
Mortgage Type
New Conventional
Purchase Details
Closed on
Dec 9, 2014
Sold by
Lee Heidi
Bought by
Park Sun Bong and Kim Mihee Kim
Home Financials for this Owner
Home Financials are based on the most recent Mortgage that was taken out on this home.
Original Mortgage
$450,000
Interest Rate
4.02%
Mortgage Type
Purchase Money Mortgage
Purchase Details
Closed on
Oct 15, 2013
Sold by
Plan B Development Llc
Bought by
Lee Heidi
Purchase Details
Closed on
May 24, 2013
Sold by
Lynx Asset Services Llc
Bought by
Plan B Development Llc
Create a Home Valuation Report for This Property
The Home Valuation Report is an in-depth analysis detailing your home's value as well as a comparison with similar homes in the area
Home Values in the Area
Average Home Value in this Area
Purchase History
| Date | Buyer | Sale Price | Title Company |
|---|---|---|---|
| Kim Daniel D | $1,100,000 | Blueland Title Agency Inc | |
| Park Sun Bong | $800,000 | None Available | |
| Lee Heidi | $796,000 | -- | |
| Plan B Development Llc | $532,000 | -- |
Source: Public Records
Mortgage History
| Date | Status | Borrower | Loan Amount |
|---|---|---|---|
| Previous Owner | Kim Daniel D | $825,000 | |
| Previous Owner | Park Sun Bong | $450,000 |
Source: Public Records
Tax History Compared to Growth
Tax History
| Year | Tax Paid | Tax Assessment Tax Assessment Total Assessment is a certain percentage of the fair market value that is determined by local assessors to be the total taxable value of land and additions on the property. | Land | Improvement |
|---|---|---|---|---|
| 2025 | $15,916 | $1,132,900 | $485,000 | $647,900 |
| 2024 | $15,550 | $1,093,900 | $462,500 | $631,400 |
| 2023 | $15,407 | $1,051,400 | $447,500 | $603,900 |
| 2022 | $15,407 | $1,001,100 | $425,000 | $576,100 |
| 2021 | $14,744 | $964,300 | $405,000 | $559,300 |
| 2020 | $14,998 | $972,000 | $400,000 | $572,000 |
| 2019 | $14,744 | $725,600 | $282,500 | $443,100 |
| 2018 | $14,360 | $725,600 | $282,500 | $443,100 |
| 2017 | $14,215 | $725,600 | $282,500 | $443,100 |
| 2016 | $13,794 | $725,600 | $282,500 | $443,100 |
| 2015 | $13,503 | $725,600 | $282,500 | $443,100 |
| 2014 | $12,894 | $716,400 | $282,500 | $433,900 |
Source: Public Records
Map
Nearby Homes
- 10 W Edsall Ave Unit B
- 50 W Columbia Ave
- 54 W Columbia Ave
- 1027 Maple Ave
- 30 Henry Ave Unit A
- 46A E Homestead Ave Unit A
- 18 Prospect St Unit 4
- 733 Grand Ave
- 109 Henry Ave Unit B
- 72 Brinkerhoff Terrace
- 213 Glen Ave
- 207 Grand Ave
- 212 E Harriet Ave Unit A
- 211 E Harriet Ave
- 755 Broad Ave Unit B
- 236 Columbus Ave Unit 5
- 235 Grantwood Blvd
- 302 E Harriet Ave
- 725 Broad Ave Unit 5A
- 333 Highland Ave Unit A
- 26 W Ruby Ave
- 26 W Ruby Ave Unit 1
- 26 W Ruby Ave Unit 2
- 26 W Ruby Ave Unit 1FL
- 26 W Ruby Ave Unit 1st Floor
- 32 W Ruby Ave
- 32 W Ruby Ave Unit B
- 32A W Ruby Ave
- 22 W Ruby Ave
- 22 W Ruby Ave Unit A OR B
- 22 W Ruby Ave Unit B
- 22 W Ruby Ave Unit A
- 32B W Ruby Ave
- 35 W Columbia Ave
- 35 W Columbia Ave Unit B
- 18-20 W Ruby Ave
- 34 W Ruby Ave
- 18 W Ruby Ave Unit 20
- 37 W Columbia Ave
- 34B W Ruby Ave