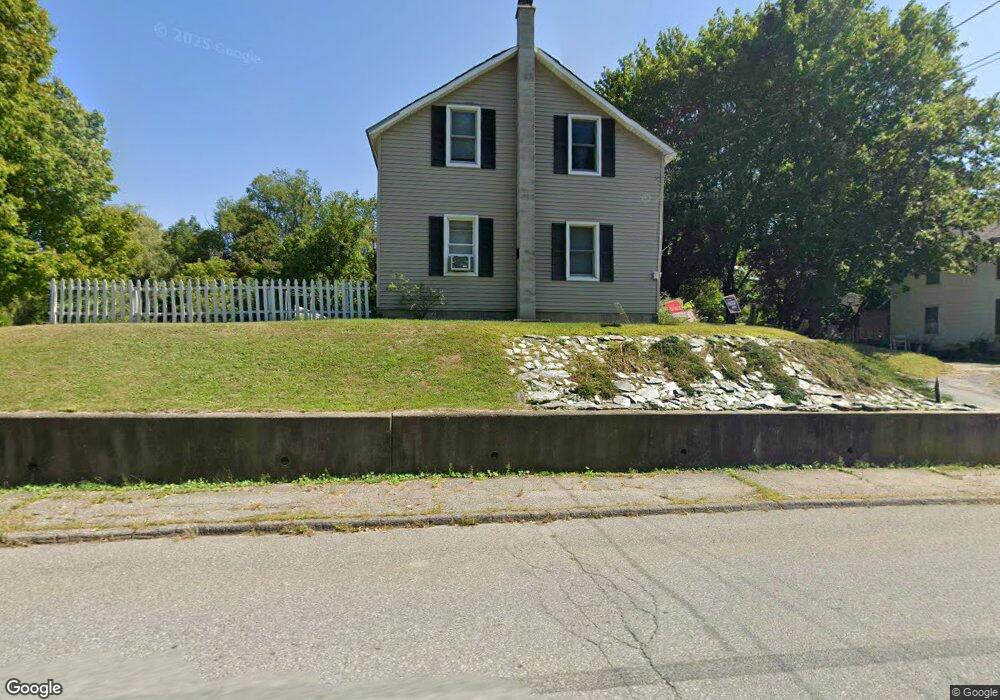
26 Walker St North Adams, MA 01247
Estimated Value: $213,000 - $239,000
3
Beds
2
Baths
1,260
Sq Ft
$183/Sq Ft
Est. Value
About This Home
This home is located at 26 Walker St, North Adams, MA 01247 and is currently estimated at $230,623, approximately $183 per square foot. 26 Walker St is a home located in Berkshire County with nearby schools including Colegrove Park Elementary School and Drury High School.
Ownership History
Date
Name
Owned For
Owner Type
Purchase Details
Closed on
Nov 5, 2021
Sold by
Witherell Francis M and Witherell Cheryl A
Bought by
Witherell-Tarsa Victoria and Witherell-Dickinson Amy
Current Estimated Value
Purchase Details
Closed on
Nov 23, 1977
Bought by
Witherell Francis M and Witherell Cheryl W
Create a Home Valuation Report for This Property
The Home Valuation Report is an in-depth analysis detailing your home's value as well as a comparison with similar homes in the area
Home Values in the Area
Average Home Value in this Area
Purchase History
| Date | Buyer | Sale Price | Title Company |
|---|---|---|---|
| Witherell-Tarsa Victoria | -- | None Available | |
| Witherell-Tarsa Victoria | -- | None Available | |
| Witherell Francis M | -- | -- |
Source: Public Records
Mortgage History
| Date | Status | Borrower | Loan Amount |
|---|---|---|---|
| Previous Owner | Witherell Francis M | $40,000 | |
| Previous Owner | Witherell Francis M | $39,000 | |
| Previous Owner | Witherell Francis M | $17,700 | |
| Previous Owner | Witherell Francis M | $20,000 |
Source: Public Records
Tax History Compared to Growth
Tax History
| Year | Tax Paid | Tax Assessment Tax Assessment Total Assessment is a certain percentage of the fair market value that is determined by local assessors to be the total taxable value of land and additions on the property. | Land | Improvement |
|---|---|---|---|---|
| 2025 | $3,088 | $184,800 | $35,900 | $148,900 |
| 2024 | $2,898 | $169,100 | $32,800 | $136,300 |
| 2023 | $2,801 | $158,500 | $32,800 | $125,700 |
| 2022 | $2,548 | $137,500 | $32,800 | $104,700 |
| 2021 | $2,369 | $127,300 | $30,400 | $96,900 |
| 2020 | $2,246 | $120,600 | $30,200 | $90,400 |
| 2019 | $2,158 | $112,900 | $30,200 | $82,700 |
| 2018 | $2,079 | $113,100 | $31,800 | $81,300 |
| 2017 | $1,979 | $112,000 | $31,500 | $80,500 |
| 2016 | $1,920 | $110,400 | $31,500 | $78,900 |
| 2015 | $1,831 | $109,700 | $32,600 | $77,100 |
Source: Public Records
Map
Nearby Homes