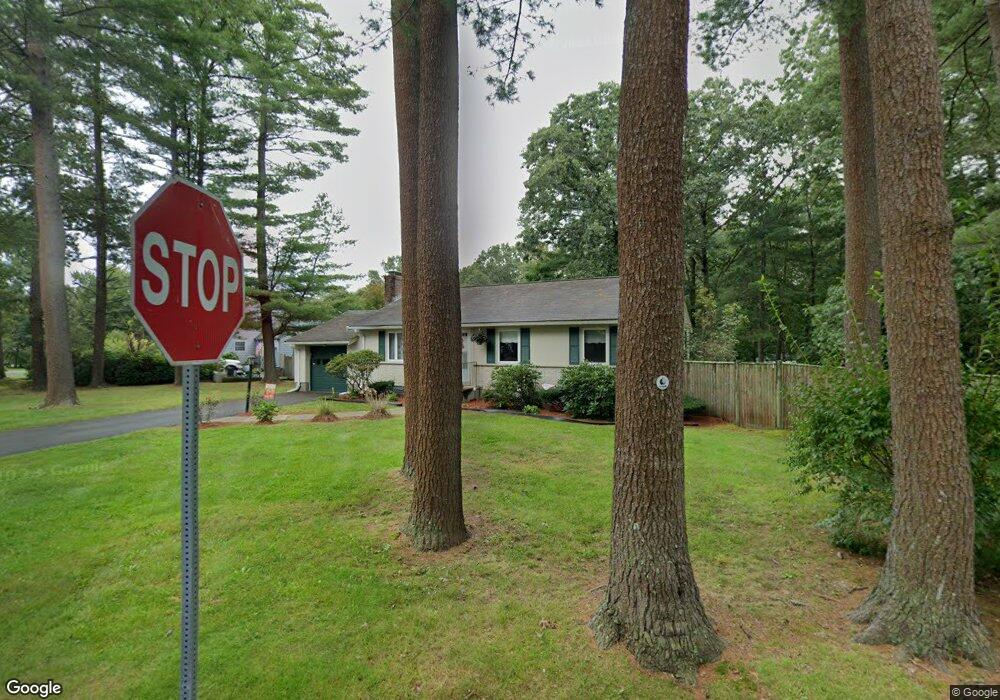
26 West St Medfield, MA 02052
Estimated Value: $742,000 - $833,000
3
Beds
2
Baths
1,376
Sq Ft
$568/Sq Ft
Est. Value
About This Home
This home is located at 26 West St, Medfield, MA 02052 and is currently estimated at $781,986, approximately $568 per square foot. 26 West St is a home located in Norfolk County with nearby schools including Memorial School, Ralph Wheelock School, and Dale Street School.
Ownership History
Date
Name
Owned For
Owner Type
Purchase Details
Closed on
May 1, 2014
Sold by
Mccloud Linda
Bought by
Mccloud Linda and Cullen Maureen E
Current Estimated Value
Purchase Details
Closed on
Nov 30, 1995
Sold by
Moses Linda J
Bought by
Schindler Ronald A and Schindler Mary M
Home Financials for this Owner
Home Financials are based on the most recent Mortgage that was taken out on this home.
Original Mortgage
$90,000
Interest Rate
7.37%
Mortgage Type
Purchase Money Mortgage
Purchase Details
Closed on
Feb 21, 1989
Sold by
Dube Scott J
Bought by
Jordan Linda A
Home Financials for this Owner
Home Financials are based on the most recent Mortgage that was taken out on this home.
Original Mortgage
$148,000
Interest Rate
10.77%
Mortgage Type
Purchase Money Mortgage
Create a Home Valuation Report for This Property
The Home Valuation Report is an in-depth analysis detailing your home's value as well as a comparison with similar homes in the area
Home Values in the Area
Average Home Value in this Area
Purchase History
| Date | Buyer | Sale Price | Title Company |
|---|---|---|---|
| Mccloud Linda | -- | -- | |
| Mccloud Linda | -- | -- | |
| Schindler Ronald A | $182,000 | -- | |
| Schindler Ronald A | $182,000 | -- | |
| Jordan Linda A | $186,000 | -- | |
| Jordan Linda A | $186,000 | -- |
Source: Public Records
Mortgage History
| Date | Status | Borrower | Loan Amount |
|---|---|---|---|
| Previous Owner | Jordan Linda A | $25,000 | |
| Previous Owner | Jordan Linda A | $90,000 | |
| Previous Owner | Jordan Linda A | $148,000 |
Source: Public Records
Tax History Compared to Growth
Tax History
| Year | Tax Paid | Tax Assessment Tax Assessment Total Assessment is a certain percentage of the fair market value that is determined by local assessors to be the total taxable value of land and additions on the property. | Land | Improvement |
|---|---|---|---|---|
| 2025 | $8,947 | $648,300 | $404,100 | $244,200 |
| 2024 | $8,690 | $593,600 | $371,400 | $222,200 |
| 2023 | $8,595 | $557,000 | $352,800 | $204,200 |
| 2022 | $8,419 | $483,300 | $334,200 | $149,100 |
| 2021 | $8,131 | $457,800 | $325,000 | $132,800 |
| 2020 | $8,100 | $454,300 | $321,200 | $133,100 |
| 2019 | $7,850 | $439,300 | $312,000 | $127,300 |
| 2018 | $6,994 | $410,700 | $292,600 | $118,100 |
| 2017 | $6,825 | $404,100 | $286,000 | $118,100 |
| 2016 | $6,737 | $402,200 | $284,100 | $118,100 |
| 2015 | $6,220 | $387,800 | $281,500 | $106,300 |
| 2014 | $5,510 | $341,800 | $235,500 | $106,300 |
Source: Public Records
Map
Nearby Homes
- 14 Harding St
- 8 Turtlebrook Way
- 3 Hennery Way Bld E Unit 3
- 21 Winter St
- 80 West St
- 46 Frairy St
- 34 Frairy St
- 75 Bridge St
- 435 Main St Unit B
- 431 Main St Unit 5
- 3 Shining Valley Cir
- 21 Philip St
- 37 Crestview Dr
- 15 Belknap Rd
- 2 Partridge Hill Rd
- 40 Grand Hill Dr
- 8 Hamlins Crossing
- 00000 S Main St and Bullard St
- 6 Rivendell Ln
- 94 Elm St