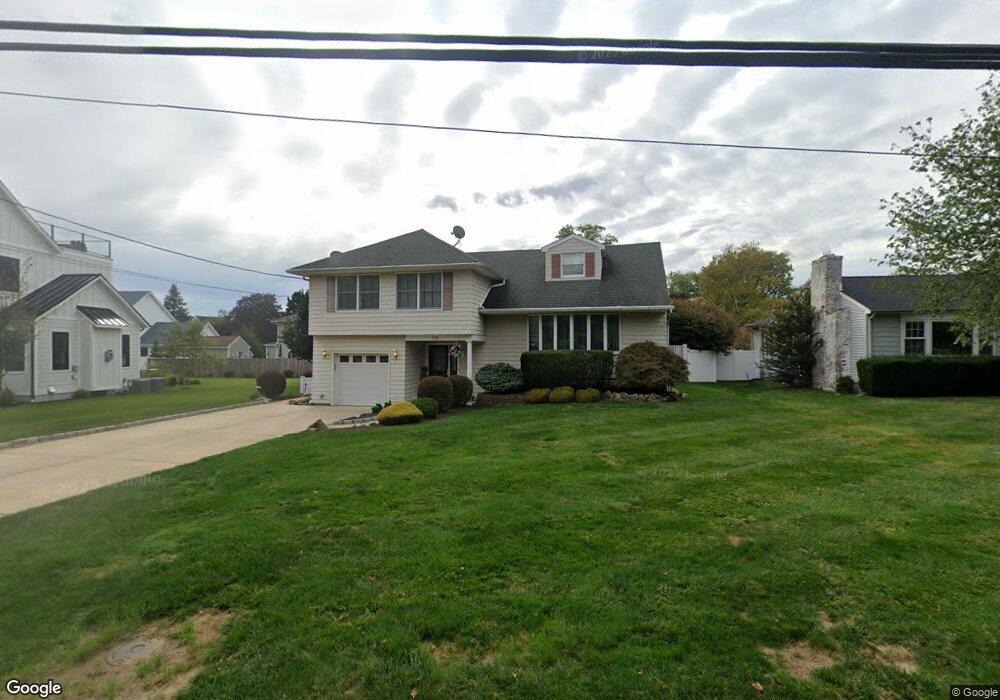
26 West St Monmouth Beach, NJ 07750
Estimated Value: $1,302,974 - $1,837,000
4
Beds
3
Baths
2,114
Sq Ft
$713/Sq Ft
Est. Value
About This Home
This home is located at 26 West St, Monmouth Beach, NJ 07750 and is currently estimated at $1,508,244, approximately $713 per square foot. 26 West St is a home located in Monmouth County with nearby schools including Monmouth Beach School District, Shore Regional High School, and Holy Cross School.
Ownership History
Date
Name
Owned For
Owner Type
Purchase Details
Closed on
Nov 13, 2021
Sold by
Routh James M and Routh Ellen K
Bought by
Routh James M and Routh Ellen K
Current Estimated Value
Purchase Details
Closed on
Mar 11, 1981
Bought by
Lynch John and Lynch Carol
Create a Home Valuation Report for This Property
The Home Valuation Report is an in-depth analysis detailing your home's value as well as a comparison with similar homes in the area
Home Values in the Area
Average Home Value in this Area
Purchase History
| Date | Buyer | Sale Price | Title Company |
|---|---|---|---|
| Routh James M | -- | None Available | |
| Lynch John | $29,000 | -- |
Source: Public Records
Tax History Compared to Growth
Tax History
| Year | Tax Paid | Tax Assessment Tax Assessment Total Assessment is a certain percentage of the fair market value that is determined by local assessors to be the total taxable value of land and additions on the property. | Land | Improvement |
|---|---|---|---|---|
| 2025 | $10,324 | $1,181,900 | $831,300 | $350,600 |
| 2024 | $10,435 | $1,058,900 | $731,300 | $327,600 |
| 2023 | $10,435 | $1,013,100 | $731,400 | $281,700 |
| 2022 | $10,085 | $932,600 | $656,400 | $276,200 |
| 2021 | $10,085 | $826,400 | $556,400 | $270,000 |
| 2020 | $10,007 | $816,200 | $531,400 | $284,800 |
| 2019 | $9,610 | $799,500 | $516,400 | $283,100 |
| 2018 | $9,161 | $745,400 | $470,700 | $274,700 |
| 2017 | $9,506 | $749,700 | $470,700 | $279,000 |
| 2016 | $9,429 | $712,700 | $440,700 | $272,000 |
| 2015 | $9,621 | $765,400 | $505,700 | $259,700 |
| 2014 | $9,637 | $741,300 | $385,700 | $355,600 |
Source: Public Records
Map
Nearby Homes
- 1 Channel Dr Unit 705
- 1 Channel Dr Unit 709
- 1 Channel Dr Unit 214
- 1 Channel Dr Unit 1705
- 9 Woolley St
- 153 Wharfside Dr
- 149 Wharfside Dr Unit 705
- 173 Wharfside Dr Unit 805
- 4 River Ave
- 75 Wharfside Dr
- 55 Ocean Ave Unit 3L
- 55 Ocean Ave Unit 3H
- 25 Spaulding Place
- 45 Ocean Ave Unit 4G
- 25 Meadow Ave Unit 30
- 8 Mann Ct
- 16 Anderson St
- 43 Valentine St
- 17 Riviera Dr
- 50 Valentine St Unit 25B