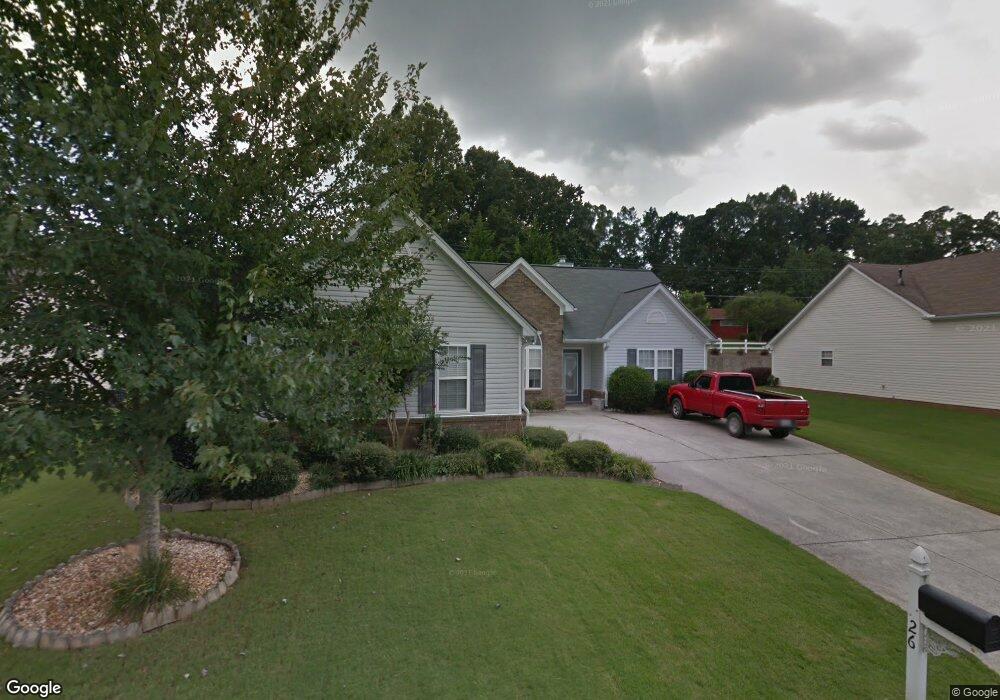
26 Winding Creek Ct Dawsonville, GA 30534
Estimated Value: $355,453 - $387,000
3
Beds
2
Baths
1,632
Sq Ft
$227/Sq Ft
Est. Value
About This Home
This home is located at 26 Winding Creek Ct, Dawsonville, GA 30534 and is currently estimated at $370,863, approximately $227 per square foot. 26 Winding Creek Ct is a home located in Dawson County with nearby schools including Riverview Elementary School, Dawson County Junior High School, and Dawson County Middle School.
Ownership History
Date
Name
Owned For
Owner Type
Purchase Details
Closed on
Oct 31, 2006
Sold by
Roach Peggy J
Bought by
Cobb Tina T
Current Estimated Value
Home Financials for this Owner
Home Financials are based on the most recent Mortgage that was taken out on this home.
Original Mortgage
$60,000
Outstanding Balance
$35,570
Interest Rate
6.25%
Mortgage Type
New Conventional
Estimated Equity
$335,293
Purchase Details
Closed on
Oct 19, 2005
Sold by
Burts Crossing Investments
Bought by
Burts Crossing Construction Ll
Purchase Details
Closed on
Sep 10, 2004
Sold by
Mcconnell Jeffrey A
Bought by
Roach Peggy J
Purchase Details
Closed on
Jan 14, 2002
Sold by
Burts Crossing Construction Ll
Bought by
Mcconnell Jeffrey A
Purchase Details
Closed on
Apr 18, 2001
Sold by
Burts Crossing Development Llc
Bought by
Burts Crossing Construction Llc
Create a Home Valuation Report for This Property
The Home Valuation Report is an in-depth analysis detailing your home's value as well as a comparison with similar homes in the area
Home Values in the Area
Average Home Value in this Area
Purchase History
| Date | Buyer | Sale Price | Title Company |
|---|---|---|---|
| Cobb Tina T | $160,000 | -- | |
| Burts Crossing Construction Ll | $576,000 | -- | |
| Roach Peggy J | $142,900 | -- | |
| Mcconnell Jeffrey A | $134,900 | -- | |
| Burts Crossing Construction Llc | $540,000 | -- |
Source: Public Records
Mortgage History
| Date | Status | Borrower | Loan Amount |
|---|---|---|---|
| Open | Cobb Tina T | $60,000 |
Source: Public Records
Tax History Compared to Growth
Tax History
| Year | Tax Paid | Tax Assessment Tax Assessment Total Assessment is a certain percentage of the fair market value that is determined by local assessors to be the total taxable value of land and additions on the property. | Land | Improvement |
|---|---|---|---|---|
| 2024 | $265 | $127,520 | $24,000 | $103,520 |
| 2023 | $724 | $128,640 | $24,000 | $104,640 |
| 2022 | $1,603 | $92,120 | $12,000 | $80,120 |
| 2021 | $1,402 | $79,280 | $12,000 | $67,280 |
| 2020 | $1,789 | $77,600 | $12,000 | $65,600 |
| 2019 | $1,598 | $68,960 | $12,000 | $56,960 |
| 2018 | $1,601 | $68,960 | $12,000 | $56,960 |
| 2017 | $1,469 | $63,414 | $12,000 | $51,414 |
| 2016 | $1,144 | $49,831 | $10,000 | $39,831 |
| 2015 | $1,084 | $45,911 | $8,000 | $37,911 |
| 2014 | $1,075 | $44,188 | $8,000 | $36,188 |
| 2013 | -- | $42,358 | $8,000 | $34,358 |
Source: Public Records
Map
Nearby Homes
- 176 J C Burt Rd
- 399 Burts Crossing Dr
- 95 Ridge Water Ln
- 91 Crockett Dr
- 21 Shepard Dr
- 653 Highway 9 S
- 270 Shepard Dr
- 15 Parks Trail
- 284 Thunder Valley
- 17 Swift Creek Dr
- 75 Pearl Chambers Dr
- 10 Pearl Chambers Dr
- 15 Pearl Chambers Dr
- 163 Richmond Dr
- 127 Angela Ln
- The Lawrence Plan at The Village at Maple Street
- 10 Winding Creek Ct
- 34 Winding Creek Ct
- 0 Winding Creek Ct
- 38 Burts Crossing Dr
- 97 J C Burt Rd
- 29 Winding Creek Ct
- 52 Winding Creek Ct
- 5 Burts Crossing Dr
- 47 Winding Creek Ct
- 17 Burts Crossing Dr
- 53 Winding Creek Ct
- 61 Winding Creek Ct
- 37 Burts Crossing Dr
- 60 Burts Crossing Dr
- 0 Burt's Crossing Dr Unit 8694624
- 0 Burt's Crossing Dr Unit 8666046
- 0 Burt's Crossing Dr Unit 8608275
- 0 Burt's Crossing Dr Unit 8593165
- 0 Burt's Crossing Dr Unit 8589801
- 0 Burt's Crossing Dr Unit 8458139