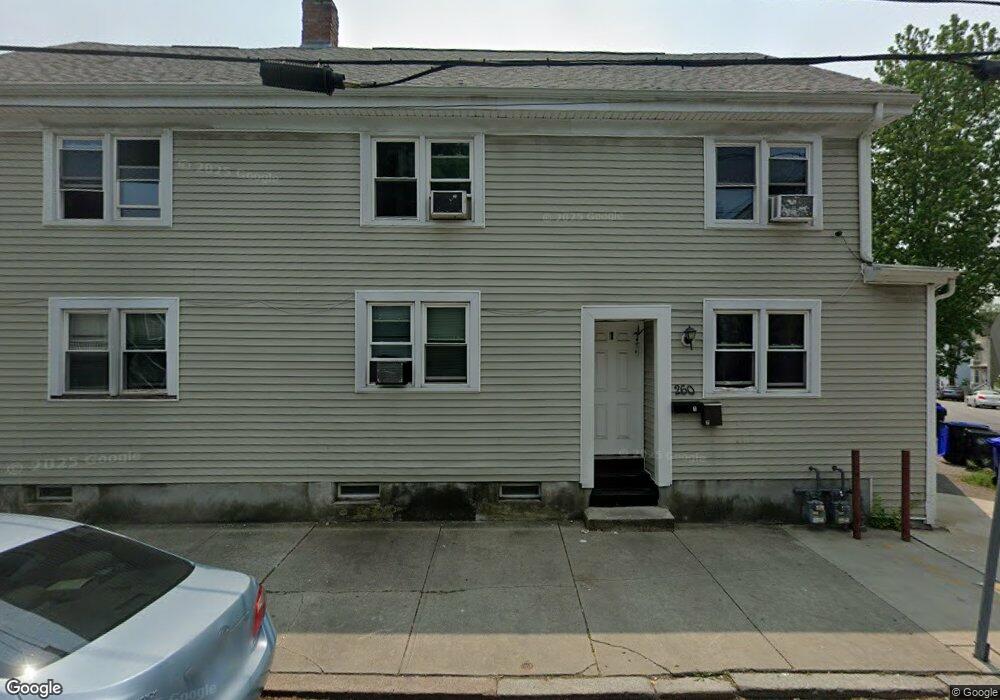
260 Amherst St Unit 1 Providence, RI 02909
Olneyville NeighborhoodEstimated Value: $460,164 - $606,000
4
Beds
1
Bath
1,422
Sq Ft
$375/Sq Ft
Est. Value
About This Home
This home is located at 260 Amherst St Unit 1, Providence, RI 02909 and is currently estimated at $533,041, approximately $374 per square foot. 260 Amherst St Unit 1 is a home located in Providence County with nearby schools including Asa Messer Elementary School, Charles N. Fortes Elementary School, and Laurel Hill Annex School.
Ownership History
Date
Name
Owned For
Owner Type
Purchase Details
Closed on
Oct 4, 2023
Sold by
Castro Kelvin
Bought by
Dieujuste Paul
Current Estimated Value
Home Financials for this Owner
Home Financials are based on the most recent Mortgage that was taken out on this home.
Original Mortgage
$412,392
Outstanding Balance
$404,079
Interest Rate
7.23%
Mortgage Type
FHA
Estimated Equity
$128,962
Purchase Details
Closed on
Apr 4, 2019
Sold by
Damico William R
Bought by
Castro Kelvin
Home Financials for this Owner
Home Financials are based on the most recent Mortgage that was taken out on this home.
Original Mortgage
$237,616
Interest Rate
4.3%
Mortgage Type
FHA
Purchase Details
Closed on
Aug 22, 2013
Sold by
Sanchez Donny and Sanchez Wyndham T
Bought by
Sanchez Donny
Purchase Details
Closed on
Dec 13, 2012
Sold by
New Fund Llc
Bought by
Sanchez Donny
Purchase Details
Closed on
Jul 25, 2012
Sold by
Bachetti Louis and Providence City Of
Bought by
Sylvan Beverly
Purchase Details
Closed on
Mar 29, 2010
Sold by
By Gone Assoc Llc
Bought by
Sylvan Beverly
Home Financials for this Owner
Home Financials are based on the most recent Mortgage that was taken out on this home.
Original Mortgage
$85,000
Interest Rate
5.02%
Mortgage Type
Purchase Money Mortgage
Purchase Details
Closed on
Mar 12, 2010
Sold by
Department Of Housing & Urban Dev
Bought by
By Gone Assoc Llc
Home Financials for this Owner
Home Financials are based on the most recent Mortgage that was taken out on this home.
Original Mortgage
$85,000
Interest Rate
5.02%
Mortgage Type
Purchase Money Mortgage
Purchase Details
Closed on
Jan 4, 2010
Sold by
Countrywide Home Loan
Bought by
Department Of Housing & Urban Dev
Purchase Details
Closed on
Dec 21, 2005
Sold by
Martinez Antonio and Martinez Aida
Bought by
Alvarez Luis
Home Financials for this Owner
Home Financials are based on the most recent Mortgage that was taken out on this home.
Original Mortgage
$249,090
Interest Rate
6.36%
Mortgage Type
Purchase Money Mortgage
Purchase Details
Closed on
Jul 27, 2004
Sold by
Christ Apostolic Chrch
Bought by
Martinez Antonio
Create a Home Valuation Report for This Property
The Home Valuation Report is an in-depth analysis detailing your home's value as well as a comparison with similar homes in the area
Home Values in the Area
Average Home Value in this Area
Purchase History
| Date | Buyer | Sale Price | Title Company |
|---|---|---|---|
| Dieujuste Paul | $420,000 | None Available | |
| Castro Kelvin | $242,000 | -- | |
| Sanchez Donny | -- | -- | |
| Sanchez Donny | $46,000 | -- | |
| New Fund Llc | -- | -- | |
| Sylvan Beverly | $3,809 | -- | |
| Sylvan Beverly | $85,000 | -- | |
| By Gone Assoc Llc | $45,000 | -- | |
| Department Of Housing & Urban Dev | -- | -- | |
| Alvarez Luis | $253,000 | -- | |
| Martinez Antonio | $129,000 | -- |
Source: Public Records
Mortgage History
| Date | Status | Borrower | Loan Amount |
|---|---|---|---|
| Open | Dieujuste Paul | $412,392 | |
| Previous Owner | Castro Kelvin | $237,616 | |
| Previous Owner | Martinez Antonio | $48,000 | |
| Previous Owner | Martinez Antonio | $85,000 | |
| Previous Owner | Martinez Antonio | $249,090 |
Source: Public Records
Tax History Compared to Growth
Tax History
| Year | Tax Paid | Tax Assessment Tax Assessment Total Assessment is a certain percentage of the fair market value that is determined by local assessors to be the total taxable value of land and additions on the property. | Land | Improvement |
|---|---|---|---|---|
| 2025 | $3,990 | $528,500 | $148,500 | $380,000 |
| 2024 | $6,400 | $348,800 | $72,300 | $276,500 |
| 2023 | $6,400 | $348,800 | $72,300 | $276,500 |
| 2022 | $6,209 | $348,800 | $72,300 | $276,500 |
| 2021 | $5,347 | $217,700 | $34,100 | $183,600 |
| 2020 | $5,347 | $217,700 | $34,100 | $183,600 |
| 2019 | $5,347 | $217,700 | $34,100 | $183,600 |
| 2018 | $3,346 | $104,700 | $28,200 | $76,500 |
| 2017 | $3,346 | $104,700 | $28,200 | $76,500 |
| 2016 | $3,346 | $104,700 | $28,200 | $76,500 |
| 2015 | $3,201 | $96,700 | $33,800 | $62,900 |
| 2014 | $3,264 | $96,700 | $33,800 | $62,900 |
| 2013 | $3,264 | $96,700 | $33,800 | $62,900 |
Source: Public Records
Map
Nearby Homes