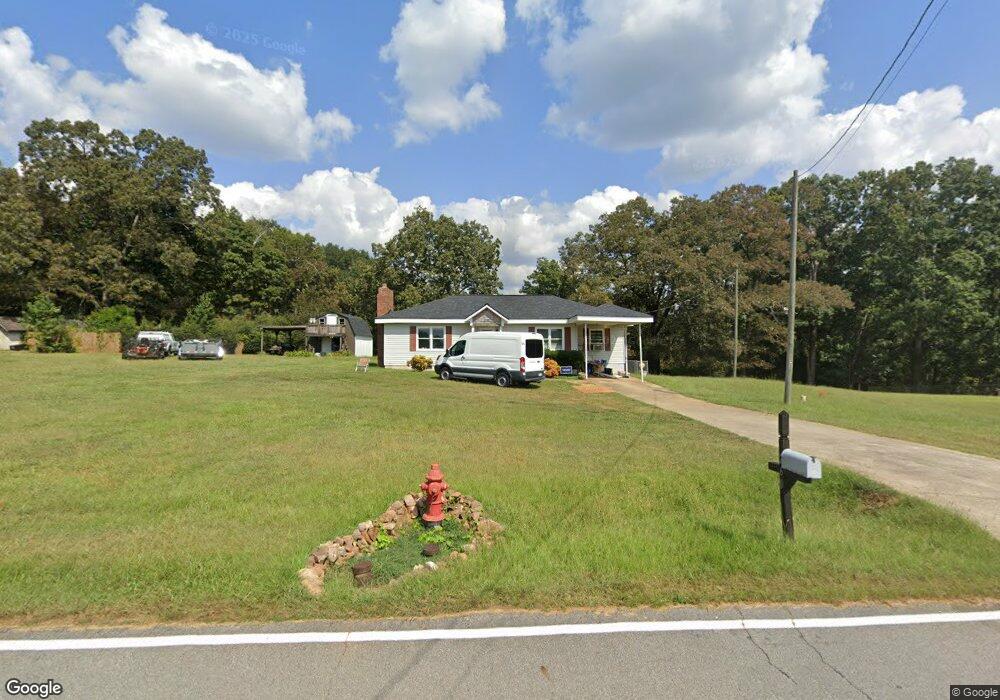
260 Ayers Rd Bowdon, GA 30108
Estimated Value: $158,000 - $241,000
3
Beds
1
Bath
1,132
Sq Ft
$169/Sq Ft
Est. Value
About This Home
This home is located at 260 Ayers Rd, Bowdon, GA 30108 and is currently estimated at $191,211, approximately $168 per square foot. 260 Ayers Rd is a home located in Carroll County with nearby schools including Bowdon Elementary School, Bowdon Middle School, and Bowdon High School.
Ownership History
Date
Name
Owned For
Owner Type
Purchase Details
Closed on
Oct 2, 2020
Sold by
Stringfellow Judith G
Bought by
Boyd David George
Current Estimated Value
Home Financials for this Owner
Home Financials are based on the most recent Mortgage that was taken out on this home.
Original Mortgage
$95,243
Outstanding Balance
$84,137
Interest Rate
2.9%
Mortgage Type
FHA
Estimated Equity
$107,074
Purchase Details
Closed on
Jan 14, 2015
Sold by
Stringfellow Bernard
Bought by
Stringfellow Judith G
Purchase Details
Closed on
May 8, 2009
Sold by
Hammonds Jimmy Wayne
Bought by
Stringfellow Bernard
Purchase Details
Closed on
Aug 21, 2001
Sold by
Williams Larry K
Bought by
Hammonds Jimmy Wayne
Purchase Details
Closed on
Jan 16, 1998
Sold by
Hammonds
Bought by
Williams Larry K
Purchase Details
Closed on
May 27, 1988
Bought by
Hammonds
Create a Home Valuation Report for This Property
The Home Valuation Report is an in-depth analysis detailing your home's value as well as a comparison with similar homes in the area
Purchase History
| Date | Buyer | Sale Price | Title Company |
|---|---|---|---|
| Boyd David George | $97,000 | -- | |
| Stringfellow Judith G | -- | -- | |
| Stringfellow Bernard | $40,000 | -- | |
| Hammonds Jimmy Wayne | -- | -- | |
| Williams Larry K | $25,000 | -- | |
| Hammonds | -- | -- |
Source: Public Records
Mortgage History
| Date | Status | Borrower | Loan Amount |
|---|---|---|---|
| Open | Boyd David George | $95,243 |
Source: Public Records
Tax History
| Year | Tax Paid | Tax Assessment Tax Assessment Total Assessment is a certain percentage of the fair market value that is determined by local assessors to be the total taxable value of land and additions on the property. | Land | Improvement |
|---|---|---|---|---|
| 2025 | $1,183 | $52,870 | $3,466 | $49,404 |
| 2024 | $1,196 | $52,870 | $3,466 | $49,404 |
| 2023 | $1,196 | $48,010 | $2,773 | $45,237 |
| 2022 | $957 | $38,138 | $1,849 | $36,289 |
| 2021 | $846 | $32,982 | $1,479 | $31,503 |
| 2020 | $754 | $29,383 | $1,345 | $28,038 |
| 2019 | $706 | $27,291 | $1,345 | $25,946 |
| 2018 | $646 | $24,597 | $1,345 | $23,252 |
| 2017 | $648 | $24,597 | $1,345 | $23,252 |
| 2016 | $648 | $24,597 | $1,345 | $23,252 |
| 2015 | $295 | $10,537 | $2,333 | $8,204 |
| 2014 | $296 | $10,538 | $2,333 | $8,204 |
Source: Public Records
Map
Nearby Homes
- 0 Ayers Rd Unit 148384
- 380 Ayers Rd Unit 149
- 380 Ayers Rd
- 2140 W Highway 166
- 2961 W Highway 166
- 2875 W Highway 166
- 0 W Highway 166 Unit 10700336
- 0 W Highway 166 Unit 150705
- 0 Stateline Rd Unit 21555538
- 0 Bartlett Cir Unit 10666514
- 110 Bartlett Cir
- 3399 Stateline Rd
- 714 Yates Rd
- 301 Angela Ave Unit 8
- 301 Angela Ave
- 309 Angela Ave
- 309 Angela Ave Unit 6
- 255 Eason St Unit 10
- 255 Eason St
- 263 Eason St Unit 12
- 240 Ayers Rd
- 0 Ayers Rd Unit 11565948
- 0 Ayers Rd Unit 143 147896
- 0 Ayers Rd Unit 7596723
- 0 Ayers Rd Unit 10540935
- 0 Ayers Rd Unit 10362907
- 0 Ayers Rd Unit 145917
- 0 Ayers Rd Unit 6879724
- 0 Ayers Rd Unit 8972493
- 0 Ayers Rd Unit 8972486
- 0 Ayers Rd Unit 6811668
- 0 Ayers Rd Unit 8880125
- 290 Ayers Rd
- 255 Ayers Rd
- 225 Ayers Rd
- 110 Ayers Rd
- 365 Ayers Rd
- 154 Ayers Rd
- 403 Ayers Rd
- 421 Ayers Rd
Your Personal Tour Guide
Ask me questions while you tour the home.