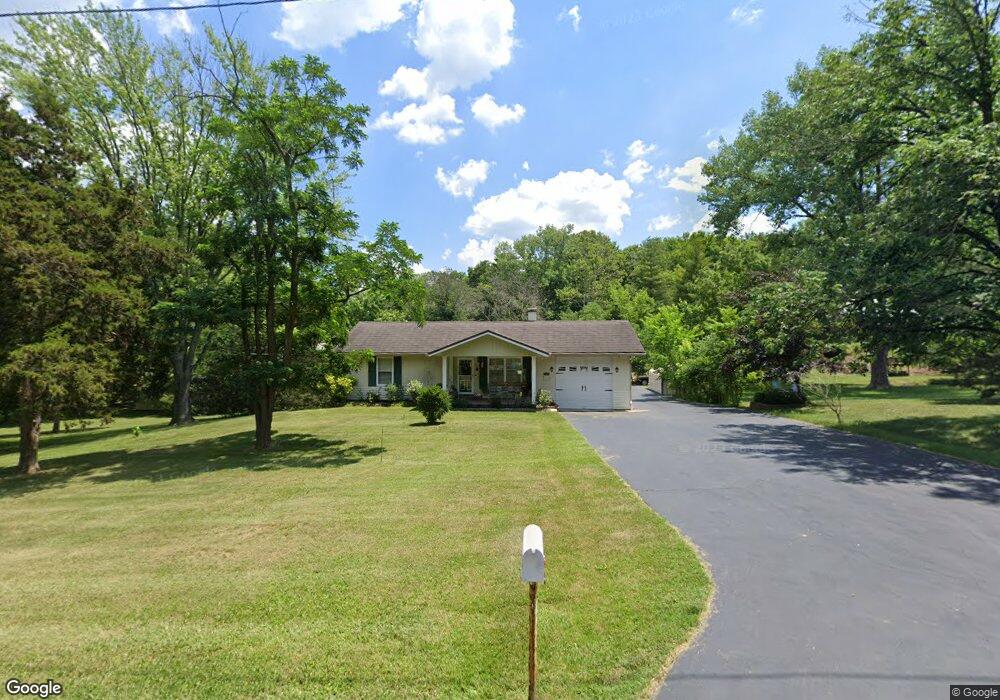
260 Bowles Ave Fenton, MO 63026
Estimated Value: $252,000 - $367,015
2
Beds
2
Baths
936
Sq Ft
$333/Sq Ft
Est. Value
About This Home
This home is located at 260 Bowles Ave, Fenton, MO 63026 and is currently estimated at $312,004, approximately $333 per square foot. 260 Bowles Ave is a home located in St. Louis County with nearby schools including Bowles Elementary School, Rockwood South Middle School, and Rockwood Summit Senior High School.
Ownership History
Date
Name
Owned For
Owner Type
Purchase Details
Closed on
Feb 8, 2002
Sold by
Kyle James C and Kyle Rosa M
Bought by
Kyle Donald L and Kyle Connie L
Current Estimated Value
Home Financials for this Owner
Home Financials are based on the most recent Mortgage that was taken out on this home.
Original Mortgage
$120,000
Interest Rate
7.12%
Create a Home Valuation Report for This Property
The Home Valuation Report is an in-depth analysis detailing your home's value as well as a comparison with similar homes in the area
Home Values in the Area
Average Home Value in this Area
Purchase History
| Date | Buyer | Sale Price | Title Company |
|---|---|---|---|
| Kyle Donald L | $200,000 | Capital Title |
Source: Public Records
Mortgage History
| Date | Status | Borrower | Loan Amount |
|---|---|---|---|
| Closed | Kyle Donald L | $120,000 |
Source: Public Records
Tax History Compared to Growth
Tax History
| Year | Tax Paid | Tax Assessment Tax Assessment Total Assessment is a certain percentage of the fair market value that is determined by local assessors to be the total taxable value of land and additions on the property. | Land | Improvement |
|---|---|---|---|---|
| 2025 | $4,650 | $70,640 | $37,010 | $33,630 |
| 2024 | $4,650 | $62,400 | $33,670 | $28,730 |
| 2023 | $4,646 | $62,400 | $33,670 | $28,730 |
| 2022 | $4,424 | $55,370 | $33,670 | $21,700 |
| 2021 | $4,390 | $55,370 | $33,670 | $21,700 |
| 2020 | $3,737 | $45,260 | $19,800 | $25,460 |
| 2019 | $3,748 | $45,260 | $19,800 | $25,460 |
| 2018 | $3,346 | $38,740 | $15,370 | $23,370 |
| 2017 | $3,319 | $38,740 | $15,370 | $23,370 |
| 2016 | $2,763 | $32,510 | $13,660 | $18,850 |
| 2015 | $2,706 | $32,510 | $13,660 | $18,850 |
| 2014 | $2,495 | $29,200 | $4,160 | $25,040 |
Source: Public Records
Map
Nearby Homes
- 711 Mosely Ct
- 811 Mary Lee Ct
- 800 Mary Lee Ct
- 928 Oak Terrace Ct
- 4 Dixie Dr
- 1281 Hawkins Bend Ct
- 1321 Green Mist Dr
- 1273 Green Falls Dr
- 10 Glen Oaks Dr
- 000 Gravois Summit
- 927 Gravois Rd
- 108 E Lark Dr
- 1320 Fenton Hills Rd
- 26 W Lakewood Dr
- 57 Lois Ln
- 1273 Pequeno Ln
- 76 Delores Dr
- 732 Rockshire Dr
- 814 Summit Glen Ct
- 1185 Scheel Ln
- 254 Bowles Ave
- 271 Bowles Ave
- 730 Mosley Ct
- 276 Trueman Heritage Pkwy
- 284 Trueman Heritage Pkwy
- 714 Mosley Ct
- 265 Bowles Ave
- 257 Bowles Ave
- 278 Bowles Ave
- 714 Mosley Ct Unit 37044466
- 714 Mosley Ct Unit 37029087
- 714 Mosley Ct Unit 37029003
- 714 Mosley Ct Unit 37028978
- 714 Mosley Ct Unit 37028763
- 714 Mosley Ct Unit 37028678
- 714 Mosley Ct Unit 36437025
- 714 Mosley Ct
- 244 Bowles Ave
- 279 Bowles Ave
- 282 Bowles Ave