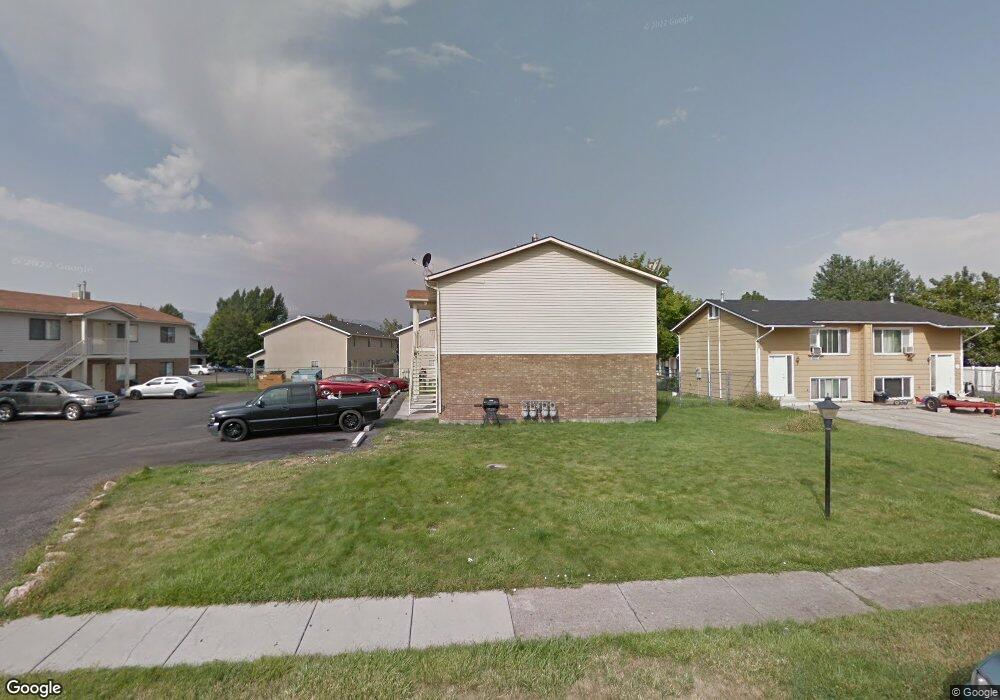
260 Bridger Dr Logan, UT 84321
Bridger NeighborhoodEstimated Value: $727,000 - $820,000
8
Beds
4
Baths
3,360
Sq Ft
$228/Sq Ft
Est. Value
About This Home
This home is located at 260 Bridger Dr, Logan, UT 84321 and is currently estimated at $765,333, approximately $227 per square foot. 260 Bridger Dr is a home located in Cache County with nearby schools including Bridger School, Mount Logan Middle School, and Logan High School.
Ownership History
Date
Name
Owned For
Owner Type
Purchase Details
Closed on
Nov 21, 2007
Sold by
Whitesides Jennifer
Bought by
Xu An Min and Xu Xiao Yin
Current Estimated Value
Home Financials for this Owner
Home Financials are based on the most recent Mortgage that was taken out on this home.
Original Mortgage
$180,000
Interest Rate
6.35%
Mortgage Type
New Conventional
Purchase Details
Closed on
Nov 16, 2007
Sold by
Bridger 260 Llc
Bought by
Xu An Min and Xu Xiao Yin
Home Financials for this Owner
Home Financials are based on the most recent Mortgage that was taken out on this home.
Original Mortgage
$180,000
Interest Rate
6.35%
Mortgage Type
New Conventional
Purchase Details
Closed on
Jan 19, 2001
Sold by
Clark Donald D and Clark Joann S
Bought by
Clark Donald D and Clark Joann S
Create a Home Valuation Report for This Property
The Home Valuation Report is an in-depth analysis detailing your home's value as well as a comparison with similar homes in the area
Home Values in the Area
Average Home Value in this Area
Purchase History
| Date | Buyer | Sale Price | Title Company |
|---|---|---|---|
| Xu An Min | -- | American Secure Title | |
| Xu An Min | -- | American Secure Title | |
| Clark Donald D | -- | -- |
Source: Public Records
Mortgage History
| Date | Status | Borrower | Loan Amount |
|---|---|---|---|
| Closed | Xu An Min | $180,000 |
Source: Public Records
Tax History Compared to Growth
Tax History
| Year | Tax Paid | Tax Assessment Tax Assessment Total Assessment is a certain percentage of the fair market value that is determined by local assessors to be the total taxable value of land and additions on the property. | Land | Improvement |
|---|---|---|---|---|
| 2025 | $3,105 | $730,030 | $219,300 | $510,730 |
| 2024 | $3,205 | $730,030 | $219,300 | $510,730 |
| 2023 | $3,343 | $725,730 | $215,000 | $510,730 |
| 2022 | $3,173 | $643,130 | $132,400 | $510,730 |
| 2021 | $3,464 | $596,700 | $132,400 | $464,300 |
| 2020 | $2,701 | $418,800 | $90,000 | $328,800 |
| 2019 | $2,824 | $418,800 | $90,000 | $328,800 |
| 2018 | $2,000 | $270,860 | $70,000 | $200,860 |
| 2017 | $1,902 | $136,180 | $0 | $0 |
| 2016 | $1,972 | $136,180 | $0 | $0 |
| 2015 | $1,974 | $136,180 | $0 | $0 |
| 2014 | $1,785 | $136,180 | $0 | $0 |
| 2013 | -- | $123,460 | $0 | $0 |
Source: Public Records
Map
Nearby Homes