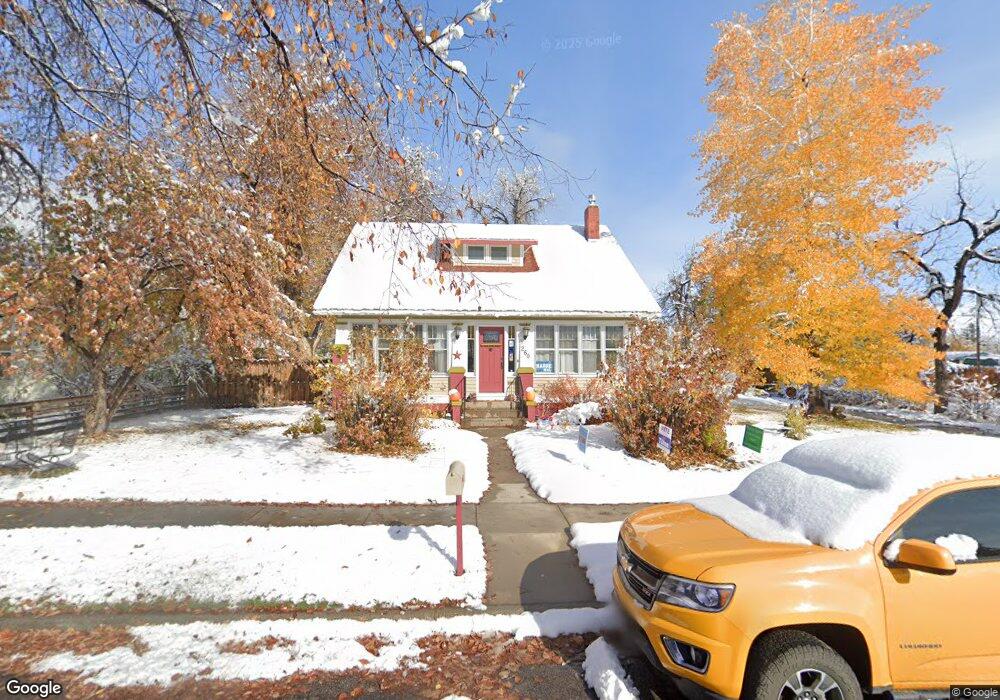
260 Cascade St Lander, WY 82520
Estimated Value: $501,000 - $540,405
3
Beds
2
Baths
2,491
Sq Ft
$209/Sq Ft
Est. Value
About This Home
This home is located at 260 Cascade St, Lander, WY 82520 and is currently estimated at $521,101, approximately $209 per square foot. 260 Cascade St is a home located in Fremont County with nearby schools including Lander Valley High School and Lander Christian Academy.
Ownership History
Date
Name
Owned For
Owner Type
Purchase Details
Closed on
Jan 5, 2024
Sold by
Garms Lawrence Alan and Garms Margaret M
Bought by
Margaret M Proctor And Lawerence A Garms Revo and Proctor
Current Estimated Value
Purchase Details
Closed on
Nov 1, 2018
Sold by
Wattenberg Lightner Jr Earl Sams and Wattenberg Lightner Elizabeth
Bought by
Garms Lawrence Alan and Proctor Margaret M
Home Financials for this Owner
Home Financials are based on the most recent Mortgage that was taken out on this home.
Original Mortgage
$318,400
Interest Rate
4.7%
Mortgage Type
New Conventional
Purchase Details
Closed on
Nov 20, 2012
Sold by
Ross Scott and Ross Pamela
Bought by
Lightner Earl Sams and Lightner Elizabeth Wattenberg
Home Financials for this Owner
Home Financials are based on the most recent Mortgage that was taken out on this home.
Original Mortgage
$285,000
Interest Rate
3.42%
Mortgage Type
New Conventional
Create a Home Valuation Report for This Property
The Home Valuation Report is an in-depth analysis detailing your home's value as well as a comparison with similar homes in the area
Home Values in the Area
Average Home Value in this Area
Purchase History
| Date | Buyer | Sale Price | Title Company |
|---|---|---|---|
| Margaret M Proctor And Lawerence A Garms Revo | -- | None Listed On Document | |
| Garms Lawrence Alan | -- | None Available | |
| Lightner Earl Sams | -- | First American Title Ins Co |
Source: Public Records
Mortgage History
| Date | Status | Borrower | Loan Amount |
|---|---|---|---|
| Previous Owner | Garms Lawrence Alan | $318,400 | |
| Previous Owner | Lightner Earl Sams | $285,000 |
Source: Public Records
Tax History
| Year | Tax Paid | Tax Assessment Tax Assessment Total Assessment is a certain percentage of the fair market value that is determined by local assessors to be the total taxable value of land and additions on the property. | Land | Improvement |
|---|---|---|---|---|
| 2025 | $3,257 | $33,143 | $4,377 | $28,766 |
| 2024 | $3,257 | $42,192 | $5,835 | $36,357 |
| 2023 | $3,086 | $40,299 | $5,295 | $35,004 |
| 2022 | $2,731 | $36,455 | $5,295 | $31,160 |
| 2021 | $2,540 | $32,817 | $5,092 | $27,725 |
| 2020 | $2,347 | $30,376 | $5,092 | $25,284 |
| 2019 | $2,319 | $29,542 | $5,092 | $24,450 |
| 2018 | $2,425 | $30,553 | $5,092 | $25,461 |
| 2017 | $2,379 | $29,900 | $5,092 | $24,808 |
| 2016 | $2,455 | $30,899 | $5,092 | $25,807 |
| 2015 | $2,424 | $30,860 | $5,092 | $25,768 |
| 2014 | $2,207 | $28,134 | $5,092 | $23,042 |
Source: Public Records
Map
Nearby Homes
Your Personal Tour Guide
Ask me questions while you tour the home.