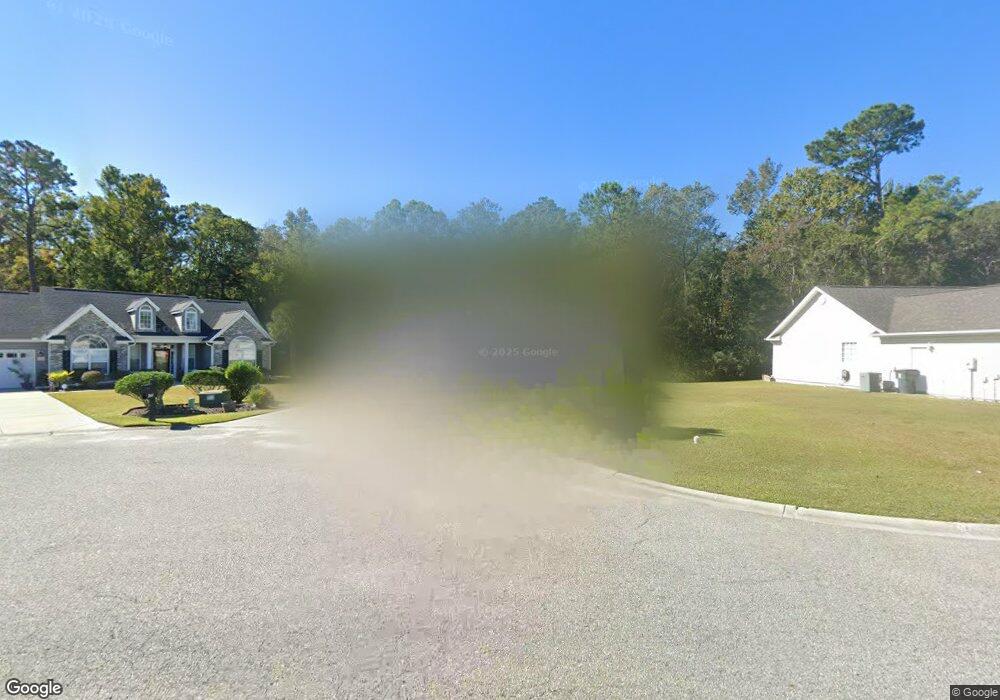
260 Colby Ct Myrtle Beach, SC 29588
Estimated Value: $311,000 - $322,000
3
Beds
2
Baths
1,718
Sq Ft
$185/Sq Ft
Est. Value
About This Home
This home is located at 260 Colby Ct, Myrtle Beach, SC 29588 and is currently estimated at $317,018, approximately $184 per square foot. 260 Colby Ct is a home located in Horry County with nearby schools including Socastee Elementary School, Forestbrook Middle School, and Socastee High School.
Ownership History
Date
Name
Owned For
Owner Type
Purchase Details
Closed on
Mar 30, 2020
Sold by
Jarrell Wanda A
Bought by
Jarrell Jeffery W and Jarrell Denise J
Current Estimated Value
Home Financials for this Owner
Home Financials are based on the most recent Mortgage that was taken out on this home.
Original Mortgage
$83,200
Outstanding Balance
$39,958
Interest Rate
3.4%
Mortgage Type
New Conventional
Estimated Equity
$277,060
Purchase Details
Closed on
Jun 18, 2009
Sold by
Jarrell Wanda A
Bought by
Jarrell Wanda A
Purchase Details
Closed on
Mar 20, 2006
Sold by
H & H Properties Llc
Bought by
Jarrell James W and Jarrell Wanda A
Home Financials for this Owner
Home Financials are based on the most recent Mortgage that was taken out on this home.
Original Mortgage
$171,000
Interest Rate
6.25%
Mortgage Type
Fannie Mae Freddie Mac
Purchase Details
Closed on
Aug 30, 2005
Sold by
Independent Builders Development Inc
Bought by
H & H Properties Llc
Create a Home Valuation Report for This Property
The Home Valuation Report is an in-depth analysis detailing your home's value as well as a comparison with similar homes in the area
Home Values in the Area
Average Home Value in this Area
Purchase History
| Date | Buyer | Sale Price | Title Company |
|---|---|---|---|
| Jarrell Jeffery W | -- | -- | |
| Jarrell Wanda A | -- | -- | |
| Jarrell James W | $213,900 | None Available | |
| H & H Properties Llc | $588,000 | -- |
Source: Public Records
Mortgage History
| Date | Status | Borrower | Loan Amount |
|---|---|---|---|
| Open | Jarrell Jeffery W | $83,200 | |
| Previous Owner | Jarrell James W | $171,000 |
Source: Public Records
Tax History Compared to Growth
Tax History
| Year | Tax Paid | Tax Assessment Tax Assessment Total Assessment is a certain percentage of the fair market value that is determined by local assessors to be the total taxable value of land and additions on the property. | Land | Improvement |
|---|---|---|---|---|
| 2024 | $936 | $12,679 | $2,952 | $9,727 |
| 2023 | $936 | $8,010 | $1,662 | $6,348 |
| 2021 | $847 | $8,010 | $1,662 | $6,348 |
| 2020 | $614 | $8,010 | $1,662 | $6,348 |
| 2019 | $614 | $8,010 | $1,662 | $6,348 |
| 2018 | $555 | $5,695 | $1,367 | $4,328 |
| 2017 | $540 | $5,695 | $1,367 | $4,328 |
| 2016 | -- | $5,695 | $1,367 | $4,328 |
| 2015 | $550 | $5,695 | $1,367 | $4,328 |
| 2014 | $509 | $5,695 | $1,367 | $4,328 |
Source: Public Records
Map
Nearby Homes
- 244 Colby Ct
- 1404 Reid Ct
- TBD W Oak Circle Dr
- 1412 Reid Ct
- 1108 Ella Ct
- 209 Foxpath Loop
- 613 Old Fox Ct
- 188 Governors Loop
- 305 Foxpath Loop
- 313 Foxpath Loop
- 800 Geddings Dr
- 5724 Dogwood Cir
- 209 Stonebrook Dr
- 1017 Shem Creek Cir Unit Bridge Creek
- 104 Meredith Ct Unit Lot 104
- 3697 Chapel Ln
- 5867 Rosewood Dr
- 66 Smith Blvd
- 619 McGee Dr
- 4 Plantation Rd