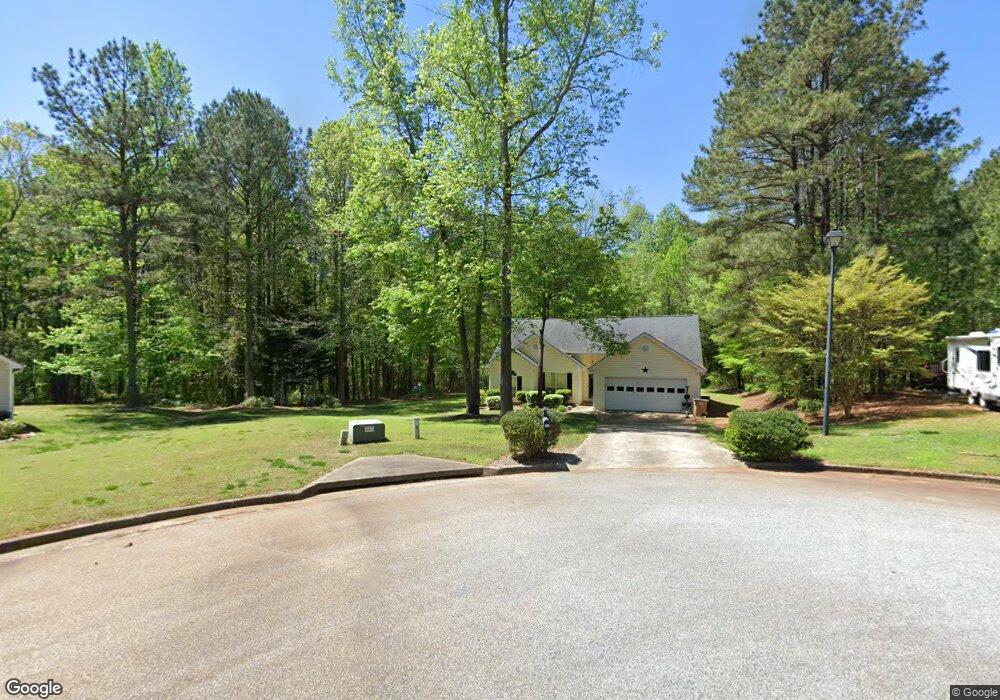
260 Crofton Ridge Unit 1 Bethlehem, GA 30620
Estimated Value: $281,161 - $319,000
--
Bed
2
Baths
1,308
Sq Ft
$232/Sq Ft
Est. Value
About This Home
This home is located at 260 Crofton Ridge Unit 1, Bethlehem, GA 30620 and is currently estimated at $303,540, approximately $232 per square foot. 260 Crofton Ridge Unit 1 is a home located in Barrow County with nearby schools including Bethlehem Elementary School, Haymon-Morris Middle School, and Apalachee High School.
Ownership History
Date
Name
Owned For
Owner Type
Purchase Details
Closed on
Aug 28, 2013
Sold by
Johnson Charles L
Bought by
Johnson Charles L
Current Estimated Value
Purchase Details
Closed on
Mar 30, 2001
Sold by
Jim Flanigan Builders
Bought by
Johnson Charles L
Home Financials for this Owner
Home Financials are based on the most recent Mortgage that was taken out on this home.
Original Mortgage
$113,715
Interest Rate
7.02%
Mortgage Type
New Conventional
Purchase Details
Closed on
Oct 5, 2000
Sold by
Developme Dun-La-Hur
Bought by
Jim Flanigan Builder
Purchase Details
Closed on
May 2, 2000
Bought by
Developme Dun-La-Hur
Create a Home Valuation Report for This Property
The Home Valuation Report is an in-depth analysis detailing your home's value as well as a comparison with similar homes in the area
Home Values in the Area
Average Home Value in this Area
Purchase History
| Date | Buyer | Sale Price | Title Company |
|---|---|---|---|
| Johnson Charles L | -- | -- | |
| Johnson Charles L | $115,500 | -- | |
| Jim Flanigan Builder | $23,000 | -- | |
| Developme Dun-La-Hur | -- | -- |
Source: Public Records
Mortgage History
| Date | Status | Borrower | Loan Amount |
|---|---|---|---|
| Previous Owner | Johnson Charles L | $113,715 |
Source: Public Records
Tax History Compared to Growth
Tax History
| Year | Tax Paid | Tax Assessment Tax Assessment Total Assessment is a certain percentage of the fair market value that is determined by local assessors to be the total taxable value of land and additions on the property. | Land | Improvement |
|---|---|---|---|---|
| 2024 | $2,103 | $93,384 | $23,200 | $70,184 |
| 2023 | $1,684 | $93,384 | $23,200 | $70,184 |
| 2022 | $1,828 | $68,368 | $16,000 | $52,368 |
| 2021 | $1,703 | $59,512 | $16,000 | $43,512 |
| 2020 | $1,552 | $53,369 | $14,000 | $39,369 |
| 2019 | $1,577 | $53,407 | $14,000 | $39,407 |
| 2018 | $1,552 | $53,407 | $14,000 | $39,407 |
| 2017 | $1,139 | $39,110 | $10,000 | $29,110 |
| 2016 | $1,066 | $36,800 | $10,000 | $26,800 |
| 2015 | $1,071 | $36,800 | $10,000 | $26,800 |
| 2014 | $969 | $33,372 | $6,272 | $27,100 |
| 2013 | -- | $32,061 | $6,272 | $25,789 |
Source: Public Records
Map
Nearby Homes
- 3153 Lowell Rd
- 468 Grand Oaks Ave
- 0 Tanners Bridge Cir Unit 10536031
- 1071 Covenant Ct
- 480 Raider Way
- 1101 Ravenwood Dr
- 763 Moss Side Dr
- 222 Lynn Rd
- 103 Camp Ct
- 384 Winslow Ct
- 3800 George Williams Rd
- 1217 Cabin Bridge Rd
- 637 Sleeping Meadow Ln
- 0 Jb Owens Unit 7552902
- 0 Jb Owens Unit 7552891
- 0 Jb Owens Unit LOT 2 - 2.09 ACRES
- 0 Jb Owens Unit LOT 3 - 2.01 ACRES
- 308 Meadows Dr
- 1035 Lucienne Blvd
- 1047 Lucienne Blvd
- 250 Crofton Ridge
- 1405 Sedgefield Trail Unit 1
- 245 Crofton Ridge
- 1415 Sedgefield Trail
- 235 Crofton Ridge
- 1425 Sedgefield Trail Unit 1
- 298 Tanners Bridge Rd
- 300 Tanners Bridge Rd
- 1420 Sedgefield Trail Unit 1
- 220 Crofton Ridge
- 225 Crofton Ridge Unit 41
- 225 Crofton Ridge
- 225 Crofton Ridge Unit 1
- 1435 Sedgefield Trail Unit 1
- 1430 Sedgefield Trail Unit 1430
- 1430 Sedgefield Trail
- 1430 Sedgefield Trail
- 1430 Sedgefield Trail
- 316 Tanners Bridge Rd
- 215 Crofton Ridge