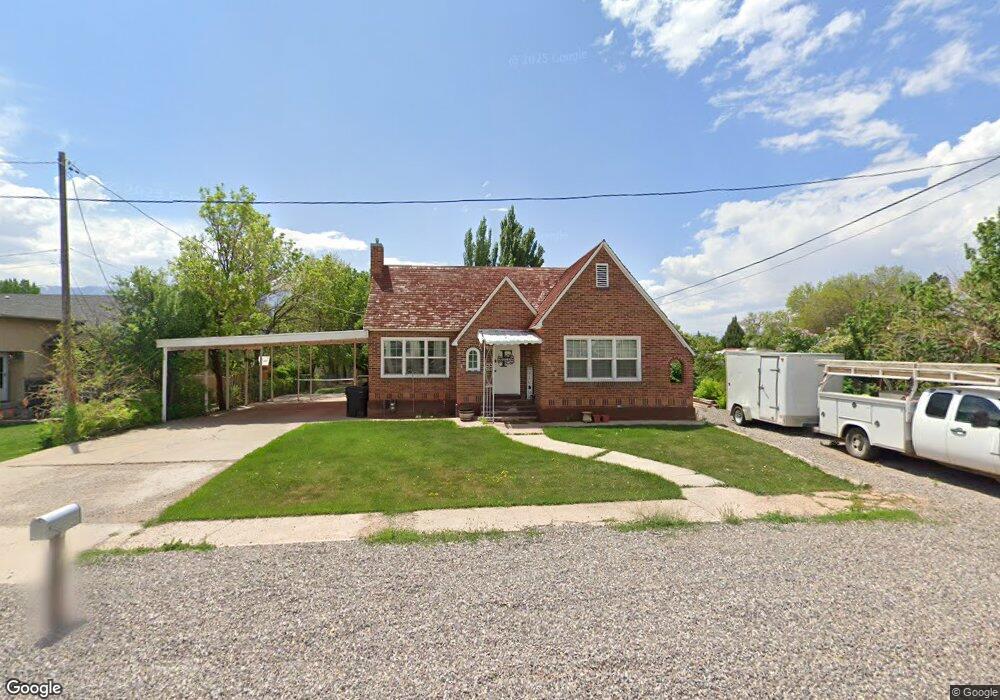
260 E 200 S Richfield, UT 84701
Estimated Value: $319,000 - $399,000
6
Beds
2
Baths
3,097
Sq Ft
$115/Sq Ft
Est. Value
About This Home
This home is located at 260 E 200 S, Richfield, UT 84701 and is currently estimated at $355,024, approximately $114 per square foot. 260 E 200 S is a home located in Sevier County with nearby schools including Ashman School, Pahvant School, and Red Hills Middle School.
Ownership History
Date
Name
Owned For
Owner Type
Purchase Details
Closed on
Oct 1, 2020
Sold by
Clay Acacia M
Bought by
Freeland Jesse A
Current Estimated Value
Home Financials for this Owner
Home Financials are based on the most recent Mortgage that was taken out on this home.
Original Mortgage
$232,707
Outstanding Balance
$205,572
Interest Rate
2.9%
Mortgage Type
New Conventional
Estimated Equity
$149,452
Purchase Details
Closed on
Sep 21, 2017
Sold by
Bell Leslie J and Bell Joyce A
Bought by
Clay Acacia M
Home Financials for this Owner
Home Financials are based on the most recent Mortgage that was taken out on this home.
Original Mortgage
$189,000
Interest Rate
3.9%
Mortgage Type
VA
Purchase Details
Closed on
Aug 5, 2005
Sold by
Bell Leslie J and Bell Joyce A
Bought by
Bell Leslie J and Bell Joyce A
Create a Home Valuation Report for This Property
The Home Valuation Report is an in-depth analysis detailing your home's value as well as a comparison with similar homes in the area
Purchase History
| Date | Buyer | Sale Price | Title Company |
|---|---|---|---|
| Freeland Jesse A | -- | First American Ttl Richfield | |
| Clay Acacia M | -- | First American Title Insuran | |
| Bell Leslie J | -- | None Available |
Source: Public Records
Mortgage History
| Date | Status | Borrower | Loan Amount |
|---|---|---|---|
| Open | Freeland Jesse A | $232,707 | |
| Previous Owner | Clay Acacia M | $189,000 |
Source: Public Records
Tax History
| Year | Tax Paid | Tax Assessment Tax Assessment Total Assessment is a certain percentage of the fair market value that is determined by local assessors to be the total taxable value of land and additions on the property. | Land | Improvement |
|---|---|---|---|---|
| 2025 | $1,607 | $165,504 | $43,989 | $121,515 |
| 2024 | $1,736 | $174,294 | $35,674 | $138,620 |
| 2023 | $1,802 | $194,300 | $32,689 | $161,611 |
| 2022 | $1,921 | $175,400 | $28,332 | $147,068 |
| 2021 | $1,658 | $127,395 | $28,759 | $98,636 |
| 2020 | $1,414 | $111,859 | $20,849 | $91,010 |
| 2019 | $1,423 | $100,810 | $17,370 | $83,440 |
| 2018 | $0 | $88,690 | $17,370 | $71,320 |
| 2017 | $1,192 | $80,660 | $17,370 | $63,290 |
| 2016 | $951 | $80,660 | $0 | $0 |
| 2015 | $951 | $82,370 | $0 | $0 |
| 2014 | $951 | $78,390 | $0 | $0 |
Source: Public Records
Map
Nearby Homes
- 75 E 400 S
- 59 E 400 S
- 442 E Center St
- 39 N 200 E
- 47 N 200 E
- 62 N 200 E
- 347 E 100 N
- 280 S 100 W
- 73 W 500 S Unit 102
- 73 W 500 S Unit 201
- 73 W 500 S Unit 204
- 73 W 500 S Unit 303
- 553 S 100 W Unit 303
- 553 S 100 W Unit 102
- 553 S 100 W Unit 201
- 553 S 100 W Unit 202
- 553 S 100 W Unit 104
- 553 S 100 W Unit 304
- 553 S 100 W Unit 103
- 553 S 100 W Unit 301
Your Personal Tour Guide
Ask me questions while you tour the home.