Estimated Value: $331,000
2
Beds
1
Bath
1,152
Sq Ft
$287/Sq Ft
Est. Value
About This Home
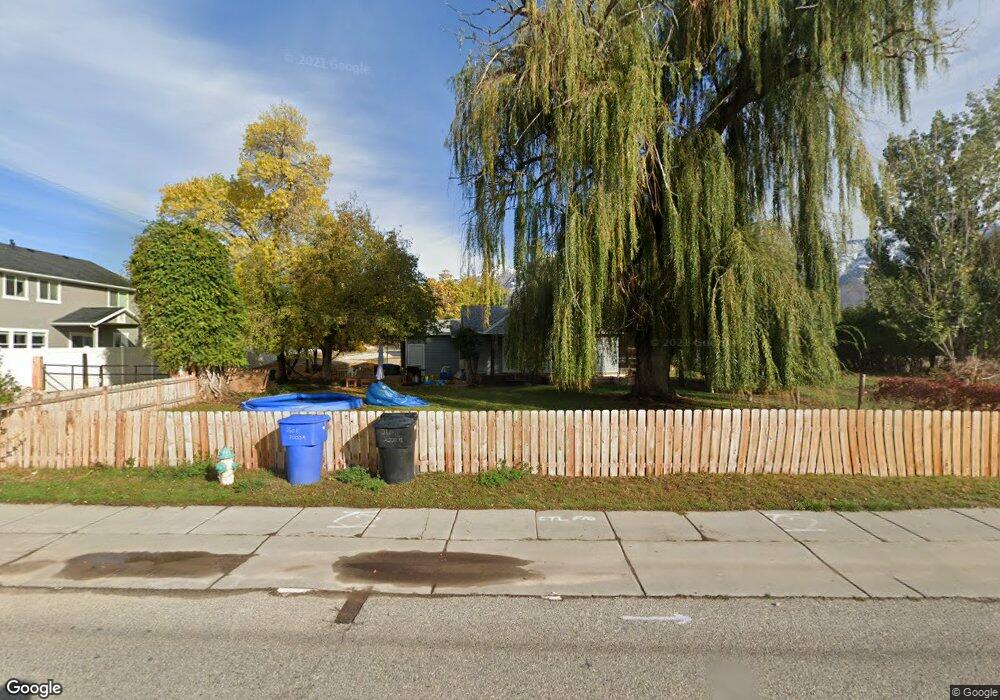
This home is located at 260 E 2000 N, Ogden, UT 84414 and is currently priced at $331,000, approximately $287 per square foot. 260 E 2000 N is a home located in Weber County with nearby schools including Majestic Elementary School, Orion Junior High School, and Weber High School.
Ownership History
Date
Name
Owned For
Owner Type
Purchase Details
Closed on
Dec 6, 2023
Sold by
Patterson Cassandra Lin
Bought by
Cannery Center Leasing Llc
Current Estimated Value
Purchase Details
Closed on
Mar 11, 2020
Sold by
Patterson Cassandra Lin and Estate Of Duane Elmer Atterson
Bought by
Patterson Cassandra Lin
Purchase Details
Closed on
Apr 8, 2015
Sold by
Child Alton H and Child Latitia M
Bought by
Patterson Duane E
Purchase Details
Closed on
Apr 13, 2005
Sold by
Child Alton H and Child Letita M
Bought by
Child Alton H and Child Letitia M
Purchase Details
Closed on
May 7, 2004
Sold by
Mccormick Jej J
Bought by
Child Alton H and Child Letitia M
Purchase Details
Closed on
Oct 27, 2003
Sold by
Hansen Marjorie Jo
Bought by
Child Alton H and Child Letitia M
Purchase Details
Closed on
Oct 22, 2003
Sold by
Auernheimer Wanda Louise
Bought by
Child Alton H and Child Letitia M
Purchase Details
Closed on
Mar 2, 1983
Sold by
Miller Garland K
Bought by
Child Alton H and Child Letitia M
Create a Home Valuation Report for This Property
The Home Valuation Report is an in-depth analysis detailing your home's value as well as a comparison with similar homes in the area
Home Values in the Area
Average Home Value in this Area
Purchase History
| Date | Buyer | Sale Price | Title Company |
|---|---|---|---|
| Cannery Center Leasing Llc | -- | Stewart Title | |
| Patterson Cassandra Lin | -- | None Available | |
| Patterson Duane E | -- | None Available | |
| Child Alton H | -- | -- | |
| Child Alton H | -- | -- | |
| Child Alton H | -- | Equity Title | |
| Mccormick Jed J | -- | Equity Title | |
| Child Alton H | -- | Equity Title | |
| Child Alton H | -- | Equity Title | |
| Child Alton H | -- | Equity Title | |
| Child Alton H | -- | -- |
Source: Public Records
Tax History
| Year | Tax Paid | Tax Assessment Tax Assessment Total Assessment is a certain percentage of the fair market value that is determined by local assessors to be the total taxable value of land and additions on the property. | Land | Improvement |
|---|---|---|---|---|
| 2023 | $1,731 | $172,152 | $77,503 | $94,649 |
| 2022 | $1,855 | $188,650 | $52,554 | $136,096 |
| 2021 | $1,569 | $270,000 | $70,402 | $199,598 |
| 2020 | $1,432 | $226,000 | $58,593 | $167,407 |
| 2019 | $1,312 | $198,000 | $53,492 | $144,508 |
| 2018 | $1,150 | $166,189 | $53,492 | $112,697 |
| 2017 | $1,067 | $150,000 | $53,492 | $96,508 |
| 2016 | $974 | $74,052 | $32,727 | $41,325 |
| 2015 | $956 | $71,725 | $32,727 | $38,998 |
| 2014 | $766 | $56,131 | $32,727 | $23,404 |
Source: Public Records
Map
Nearby Homes
- 185 E 2100 N
- 215 E Montgomery Ln
- 285 E 1850 N Unit 45
- 247 E 1850 N Unit 4
- 247 E 1850 N Unit 2
- 2243 N 225 E Unit 64
- 270 E 1825 N Unit 53
- 290 E 1825 N Unit 58
- 263 E 1825 N Unit 79
- 422 E 2050 N Unit 4C
- 422 E 2050 N Unit 5C
- 225 E 2300 N
- 363 E 2300 N
- 1255 N 300 East St Unit 183
- 1249 N 300 East St Unit 184
- 484 E 2050 N
- 1978 N 225 W Unit 72
- 2421 N 400 E Unit C4
- 2421 N 400 E Unit R3
- 2421 N 400 E Unit A6
- 2002 N 225 E
- 255 E Sleepy Hollow Way
- 255 E 2050 N
- 247 E Sleepy Hollow Way
- 247 E 2050 N
- 261 E 2050 N
- 2026 N 225 E
- 259 E 2000 N
- 239 E 2050 N
- 239 E Sleepy Hollow Way
- 267 E Sleepy Hollow Way
- 267 E Sleepy Hollow Way
- 267 E 2050 N
- 100 E 2000 N
- 100 E 2000 N
- 304 E 2000 N
- 2005 N 225 E
- 2038 N 225 E
- 2068 N 250 E
- 2017 N 225 E
Your Personal Tour Guide
Ask me questions while you tour the home.