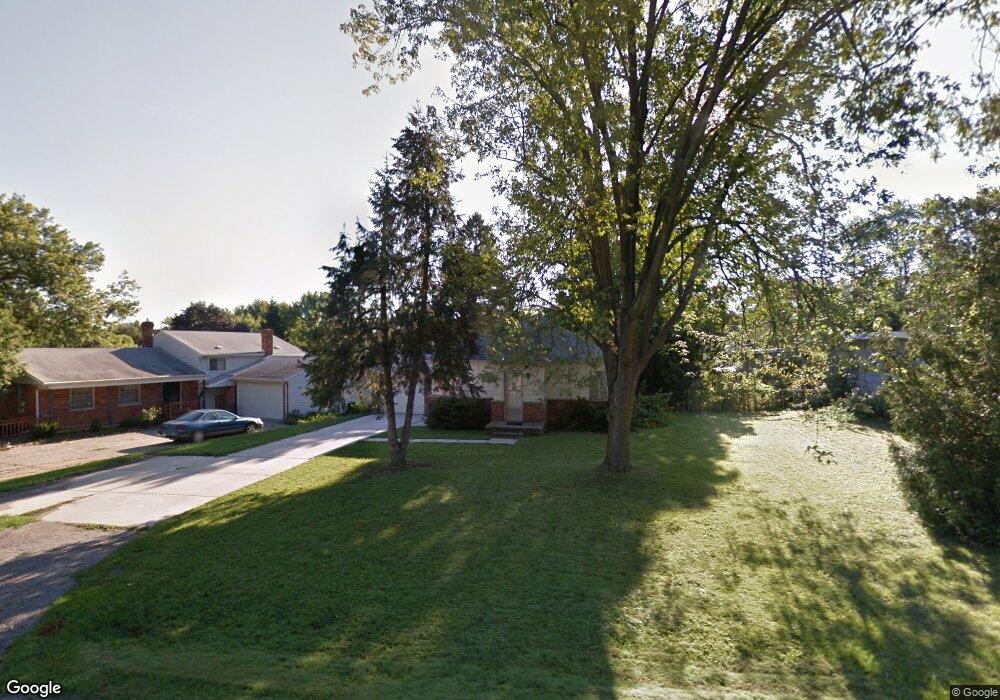
260 Elmhurst St Ypsilanti, MI 48197
Estimated Value: $250,000 - $288,544
3
Beds
2
Baths
1,063
Sq Ft
$246/Sq Ft
Est. Value
About This Home
This home is located at 260 Elmhurst St, Ypsilanti, MI 48197 and is currently estimated at $261,386, approximately $245 per square foot. 260 Elmhurst St is a home located in Washtenaw County with nearby schools including Estabrook Elementary School, Holmes Elementary School, and Erickson Elementary School.
Ownership History
Date
Name
Owned For
Owner Type
Purchase Details
Closed on
Mar 10, 2025
Sold by
Steiner Scott Stanley and Steiner Matthew C
Bought by
Barense Chandler and Danielsen Joanna
Current Estimated Value
Home Financials for this Owner
Home Financials are based on the most recent Mortgage that was taken out on this home.
Original Mortgage
$207,100
Outstanding Balance
$206,017
Interest Rate
6.76%
Mortgage Type
New Conventional
Estimated Equity
$55,369
Purchase Details
Closed on
Sep 28, 2021
Sold by
Steiner Matthew C and Steiner Stephanie A
Bought by
Steiner Scott S
Purchase Details
Closed on
Feb 16, 2018
Sold by
Estate Of George A Berklich
Bought by
Steiner Mathew C and Steiner Stephanie A
Home Financials for this Owner
Home Financials are based on the most recent Mortgage that was taken out on this home.
Original Mortgage
$155,200
Interest Rate
3.99%
Mortgage Type
New Conventional
Create a Home Valuation Report for This Property
The Home Valuation Report is an in-depth analysis detailing your home's value as well as a comparison with similar homes in the area
Home Values in the Area
Average Home Value in this Area
Purchase History
| Date | Buyer | Sale Price | Title Company |
|---|---|---|---|
| Barense Chandler | $252,000 | None Listed On Document | |
| Barense Chandler | $252,000 | None Listed On Document | |
| Steiner Scott S | $200,000 | None Available | |
| Steiner Mathew C | $160,000 | None Available |
Source: Public Records
Mortgage History
| Date | Status | Borrower | Loan Amount |
|---|---|---|---|
| Open | Barense Chandler | $207,100 | |
| Closed | Barense Chandler | $207,100 | |
| Previous Owner | Steiner Mathew C | $155,200 |
Source: Public Records
Tax History Compared to Growth
Tax History
| Year | Tax Paid | Tax Assessment Tax Assessment Total Assessment is a certain percentage of the fair market value that is determined by local assessors to be the total taxable value of land and additions on the property. | Land | Improvement |
|---|---|---|---|---|
| 2025 | -- | $133,400 | $0 | $0 |
| 2024 | $3,171 | $125,800 | $0 | $0 |
| 2023 | $2,577 | $108,000 | $0 | $0 |
| 2022 | -- | $98,500 | $0 | $0 |
| 2021 | $2,508 | $84,300 | $0 | $0 |
| 2020 | $4,095 | $80,600 | $0 | $0 |
| 2019 | $2,577 | $73,200 | $73,200 | $0 |
| 2018 | $0 | $70,800 | $0 | $0 |
| 2017 | $2,584 | $71,100 | $0 | $0 |
| 2016 | $1,611 | $54,305 | $0 | $0 |
| 2015 | $2,402 | $54,143 | $0 | $0 |
| 2014 | $2,402 | $52,452 | $0 | $0 |
| 2013 | -- | $52,452 | $0 | $0 |
Source: Public Records
Map
Nearby Homes
- 259 Elmhurst Ave
- 224 N Hewitt Rd
- 2002 Midvale Ave
- 2434 Harding Ave
- 2017 Harding Ave
- 2418 Draper Ave
- 550 Brookside St
- 2180 Ellsworth Rd
- 2600 Collegewood St
- 2564 Collegewood St
- 1636 Washtenaw Ave
- 1307 N Congress St
- 1621 Whittier Rd
- 1221 S Congress St
- 95 S Mansfield St
- 1805 S Congress St
- 1133 S Congress St
- 246 Kirk St
- 1117 Pearl St
- 1211 Washtenaw Ave
- 266 Elmhurst St
- 2300 Midvale St
- 272 Elmhurst St
- 0 Elmhurst Ave
- 276 Elmhurst St
- 263 N Hewitt Rd
- 271 N Hewitt Rd
- 255 N Hewitt Rd
- 242 Elmhurst Ave
- 259 Elmhurst St
- 2404 Midvale St
- 263 Elmhurst St
- 2245 Midvale St
- 279 N Hewitt Rd
- 269 Elmhurst St
- 240 Elmhurst St
- 2225 Midvale St
- 243 Elmhurst St
- 277 Elmhurst St
- 2245 Valley Dr