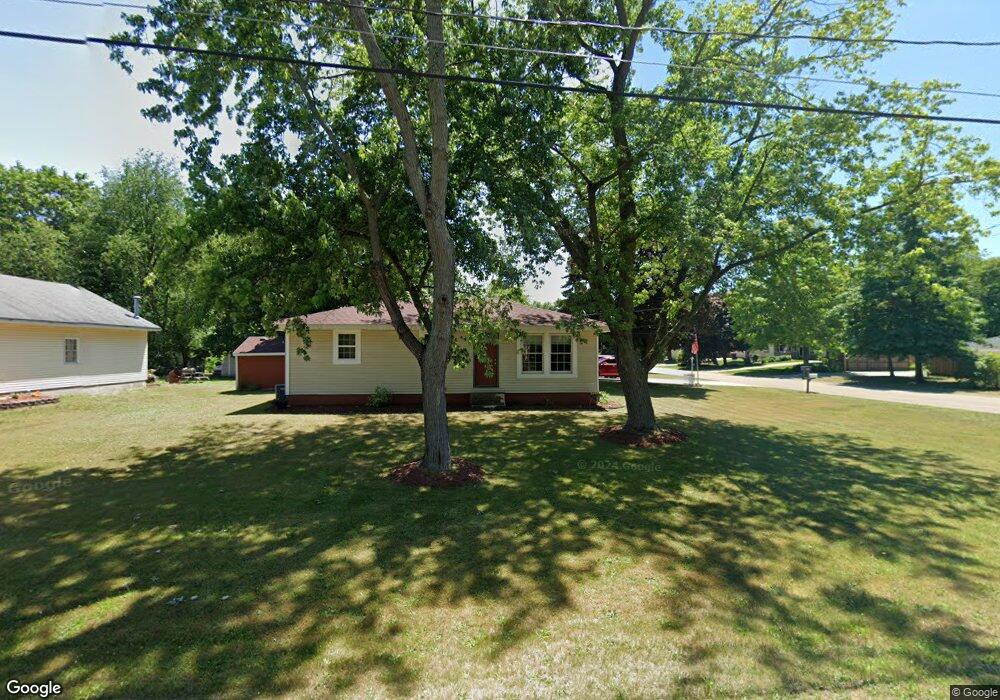
260 Franklin St Holland, MI 49424
Estimated Value: $294,000 - $326,000
3
Beds
2
Baths
1,284
Sq Ft
$239/Sq Ft
Est. Value
About This Home
This home is located at 260 Franklin St, Holland, MI 49424 and is currently estimated at $307,108, approximately $239 per square foot. 260 Franklin St is a home located in Ottawa County with nearby schools including Woodside Elementary School, Macatawa Bay Middle School, and West Ottawa High School.
Ownership History
Date
Name
Owned For
Owner Type
Purchase Details
Closed on
Feb 6, 2015
Sold by
Vanorder Thomas and Vanorder Marie
Bought by
Thomas & Marie Vanorder Trust
Current Estimated Value
Purchase Details
Closed on
Oct 27, 2011
Sold by
Secretary Of Housing & Urban Development
Bought by
Vanorder Thomas and Van Order Marie
Purchase Details
Closed on
Nov 1, 2010
Sold by
Towne Mortgage Company
Bought by
The Secretary Of Housing & Urban Develop
Purchase Details
Closed on
Apr 29, 2010
Sold by
Perry Angela R Tyson and Perry Jerry L
Bought by
Towne Mortgage Company
Create a Home Valuation Report for This Property
The Home Valuation Report is an in-depth analysis detailing your home's value as well as a comparison with similar homes in the area
Home Values in the Area
Average Home Value in this Area
Purchase History
| Date | Buyer | Sale Price | Title Company |
|---|---|---|---|
| Thomas & Marie Vanorder Trust | -- | None Available | |
| Vanorder Thomas | $53,000 | None Available | |
| The Secretary Of Housing & Urban Develop | -- | None Available | |
| Towne Mortgage Company | $114,098 | None Available |
Source: Public Records
Tax History Compared to Growth
Tax History
| Year | Tax Paid | Tax Assessment Tax Assessment Total Assessment is a certain percentage of the fair market value that is determined by local assessors to be the total taxable value of land and additions on the property. | Land | Improvement |
|---|---|---|---|---|
| 2025 | $2,420 | $132,400 | $0 | $0 |
| 2024 | $1,833 | $126,800 | $0 | $0 |
| 2023 | $1,769 | $109,200 | $0 | $0 |
| 2022 | $2,270 | $105,600 | $0 | $0 |
| 2021 | $2,208 | $100,500 | $0 | $0 |
| 2020 | $2,131 | $92,800 | $0 | $0 |
| 2019 | $2,107 | $66,400 | $0 | $0 |
| 2018 | $1,946 | $80,400 | $14,000 | $66,400 |
| 2017 | $1,916 | $75,800 | $0 | $0 |
| 2016 | $1,905 | $72,100 | $0 | $0 |
| 2015 | $1,824 | $67,300 | $0 | $0 |
| 2014 | $1,824 | $62,200 | $0 | $0 |
Source: Public Records
Map
Nearby Homes
- 257 Mae Rose Ave
- 888 S Kingwood Ct
- 1020 Katra Ln Unit 52
- 125 Liberty St
- 286 Felch St
- 790 Mayfield Ave
- 901 Butternut Dr
- 785 Mary Ave
- 961 Shadybrook Dr
- 13652 Signature Dr
- 13654 Signature Dr
- 14159 Pheasant Run
- 14145 Carol St
- V/L Jack St
- 13182 Greenly St
- 490 James St
- 14298 Carol St
- 2496 Oak Forest Dr
- The Silverton Plan at West Ottawa Homesites
- The Poppy Plan at West Ottawa Homesites
- 252 Franklin St
- 323 Elemeda St
- 276 Franklin St
- 242 Franklin St
- 257 Franklin St
- 315 Elemeda St
- 267 Franklin St
- 322 Elemeda St
- 247 Franklin St
- 271 Franklin St
- 284 Franklin St
- 234 Franklin St
- 314 Elemeda St
- 307 Elemeda St
- 237 Franklin St
- 285 Franklin St
- 258 Riley St
- 268 Riley St
- 306 Elemeda St
- 248 Riley St