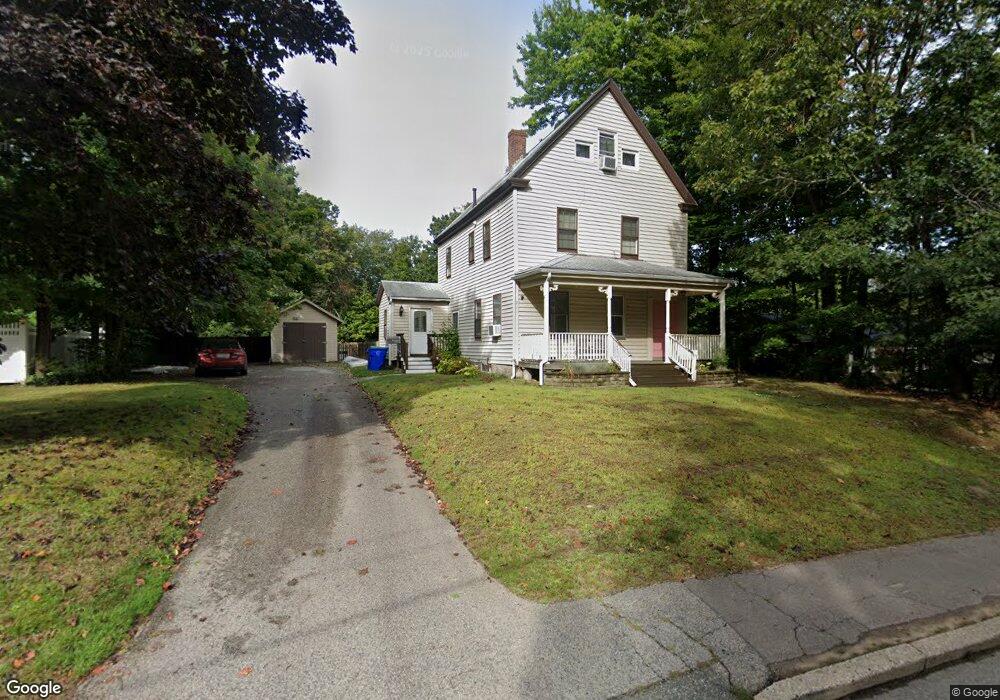
260 Hingham St Rockland, MA 02370
Estimated Value: $562,000 - $644,000
About This Home
This home is located at 260 Hingham St, Rockland, MA 02370 and is currently estimated at $587,322, approximately $317 per square foot. 260 Hingham St is a home located in Plymouth County with nearby schools including Rockland Senior High School, Calvary Chapel Academy, and Holy Family Elementary School.
Ownership History
We collect this data history from publicly available records. To have your information removed, we recommend requesting removal directly through your county’s website.
Purchase Details
Home Financials for this Owner
Home Financials are based on the most recent Mortgage that was taken out on this home.Home Values in the Area
Average Home Value in this Area
Purchase History
We collect this data history from publicly available records. To have your information removed, we recommend requesting removal directly through your county’s website.
| Date | Buyer | Sale Price | Title Company |
|---|---|---|---|
| $295,000 | -- |
Mortgage History
We collect this data history from publicly available records. To have your information removed, we recommend requesting removal directly through your county’s website.
| Date | Status | Borrower | Loan Amount |
|---|---|---|---|
| Open | $236,000 | ||
| Closed | $44,250 |
Tax History
We collect this data history from publicly available records. To have your information removed, we recommend requesting removal directly through your county’s website.
| Year | Tax Paid | Tax Assessment Tax Assessment Total Assessment is a certain percentage of the fair market value that is determined by local assessors to be the total taxable value of land and additions on the property. | Land | Improvement |
|---|---|---|---|---|
| 2025 | $6,317 | $462,100 | $218,000 | $244,100 |
| 2024 | $6,132 | $436,100 | $205,600 | $230,500 |
| 2023 | $5,946 | $390,700 | $178,700 | $212,000 |
| 2022 | $5,703 | $340,500 | $155,400 | $185,100 |
| 2021 | $7,618 | $303,100 | $141,200 | $161,900 |
| 2020 | $5,058 | $289,000 | $134,500 | $154,500 |
| 2019 | $6,093 | $275,700 | $128,100 | $147,600 |
| 2018 | $4,703 | $258,100 | $128,100 | $130,000 |
| 2017 | $3,600 | $247,100 | $128,100 | $119,000 |
| 2016 | $4,397 | $237,800 | $123,200 | $114,600 |
| 2015 | $4,365 | $229,400 | $115,200 | $114,200 |
| 2014 | $4,127 | $225,000 | $112,900 | $112,100 |
Map
- 13 Midfield Dr Unit 13
- 15 Midfield Dr Unit 15
- 491 Webster St
- 659 Liberty St
- 375 Webster St
- 196 Myrtle St
- 142 Marks St
- 70 Holly Berry Ln
- 48 Bigelow Ave
- 92-94 Stanton St
- 313 E Water St
- 31 Delprete Ave
- 471 Union St
- 42 Bard Rock Ln
- 27 Stanton St
- 874 Union St
- 4 Leslie Ct
- 173 Liberty St
- 49 Custer St
- 9 Juniper Cir
- 250 Hingham St
- 268 Hingham St Unit 268
- 266 Hingham St Unit 268
- 18-20 Cobb Dr
- 18 Cobb Dr Unit 20
- 20 Cobb Dr
- 28-30 Cobb Dr
- 19 Cobb Dr Unit 21
- 28 Cobb Dr Unit 30
- 30 Cobb Dr
- 30 Cobb Dr Unit 30
- 21 Cobb Dr
- 21 Cobb Dr
- 253 Hingham St
- 282 Hingham St
- 280 Hingham St Unit 282
- 19-21 Cobb Dr
- 1&3 Millenium
- 245 Hingham St
- 230 Hingham St
Ask me questions while you tour the home.