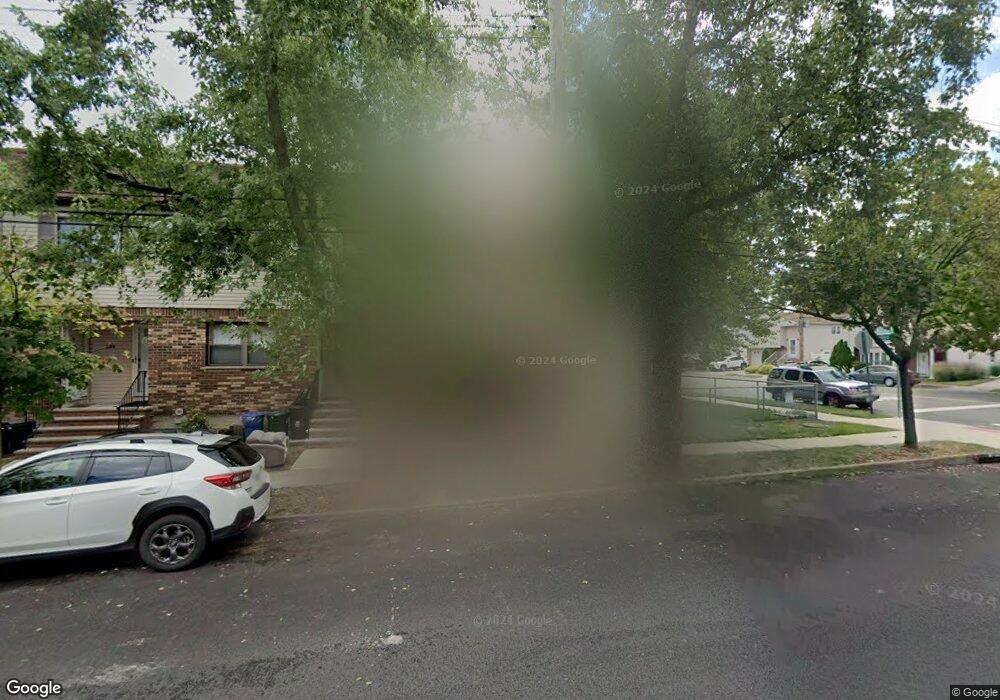
260 Katan Ave Unit B Staten Island, NY 10308
Great Kills NeighborhoodEstimated Value: $449,866 - $470,000
2
Beds
1
Bath
1,296
Sq Ft
$357/Sq Ft
Est. Value
About This Home
This home is located at 260 Katan Ave Unit B, Staten Island, NY 10308 and is currently estimated at $462,717, approximately $357 per square foot. 260 Katan Ave Unit B is a home located in Richmond County with nearby schools including P.S. 32 The Gifford School, Myra S. Barnes Intermediate School 24, and New Dorp High School.
Ownership History
Date
Name
Owned For
Owner Type
Purchase Details
Closed on
Jun 18, 2009
Sold by
Enriquez David and Enriquez Patricia
Bought by
Stomboli Kim
Current Estimated Value
Home Financials for this Owner
Home Financials are based on the most recent Mortgage that was taken out on this home.
Original Mortgage
$250,381
Outstanding Balance
$158,961
Interest Rate
4.86%
Mortgage Type
FHA
Estimated Equity
$303,756
Purchase Details
Closed on
Jun 28, 1999
Sold by
Anderson Karen
Bought by
Enriquez David and Enriquez Patricia
Home Financials for this Owner
Home Financials are based on the most recent Mortgage that was taken out on this home.
Original Mortgage
$86,400
Interest Rate
7.83%
Purchase Details
Closed on
May 23, 1996
Sold by
Ciavattoni Richard L
Bought by
Anderson Karen
Create a Home Valuation Report for This Property
The Home Valuation Report is an in-depth analysis detailing your home's value as well as a comparison with similar homes in the area
Home Values in the Area
Average Home Value in this Area
Purchase History
| Date | Buyer | Sale Price | Title Company |
|---|---|---|---|
| Stomboli Kim | $255,000 | Lawyers Title Insurance | |
| Enriquez David | $96,500 | -- | |
| Anderson Karen | $102,500 | -- |
Source: Public Records
Mortgage History
| Date | Status | Borrower | Loan Amount |
|---|---|---|---|
| Open | Stomboli Kim | $250,381 | |
| Previous Owner | Enriquez David | $86,400 |
Source: Public Records
Tax History Compared to Growth
Tax History
| Year | Tax Paid | Tax Assessment Tax Assessment Total Assessment is a certain percentage of the fair market value that is determined by local assessors to be the total taxable value of land and additions on the property. | Land | Improvement |
|---|---|---|---|---|
| 2025 | $3,325 | $30,080 | $1,453 | $28,627 |
| 2024 | $3,337 | $27,029 | $1,604 | $25,425 |
| 2023 | $3,156 | $16,938 | $1,624 | $15,314 |
| 2022 | $2,903 | $22,425 | $2,415 | $20,010 |
| 2021 | $2,870 | $21,032 | $2,415 | $18,617 |
| 2020 | $2,895 | $21,505 | $2,415 | $19,090 |
| 2019 | $2,837 | $18,711 | $2,415 | $16,296 |
| 2018 | $2,580 | $14,115 | $1,964 | $12,151 |
| 2017 | $2,415 | $13,317 | $2,011 | $11,306 |
| 2016 | $2,202 | $12,564 | $1,939 | $10,625 |
| 2015 | $2,088 | $12,564 | $1,924 | $10,640 |
| 2014 | $2,088 | $12,468 | $2,149 | $10,319 |
Source: Public Records
Map
Nearby Homes
- 221 B Katan Ave
- 68 Margaret St
- 28 N Rhett Ave
- 108 Giffords Ln
- 17 Wilson Ave
- 21 Wilson Ave
- 151 Abingdon Ave
- 15 Woodland Ave
- 67 Wilson Ave
- 12 Saccheri Ct
- 63 Genesee Ave
- 52 Pleasant St
- 43 Fern Ave
- 4157 Amboy Rd Unit H
- 200 Giffords Ln
- 223 Abingdon Ave
- 271 Doane Ave
- 96 Genesee Ave
- 270 Leverett Ave
- 4189 Amboy Rd Unit 1B
- 230 Katan Ave Unit 230A
- 230 Katan Ave Unit B
- 240 Katan Ave Unit A
- 260 Katan Ave Unit A
- 230 Katan Ave
- 240 Katan Ave Unit B
- 260 Katan Ave
- 230 Katan Ave Unit A
- 240B Katan Ave Unit B
- 228 Katan Ave Unit B
- 228 Katan Ave Unit A
- 242 Katan Ave Unit B
- 242 Katan Ave Unit A
- 226 Katan Ave Unit A
- 244 Katan Ave Unit B
- 244 Katan Ave Unit A
- 246 Katan Ave Unit B
- 246 Katan Ave Unit A
- 75 Margaret St
- 224 Katan Ave Unit B