Estimated Value: $240,793 - $467,000
2
Beds
1
Bath
1,260
Sq Ft
$275/Sq Ft
Est. Value
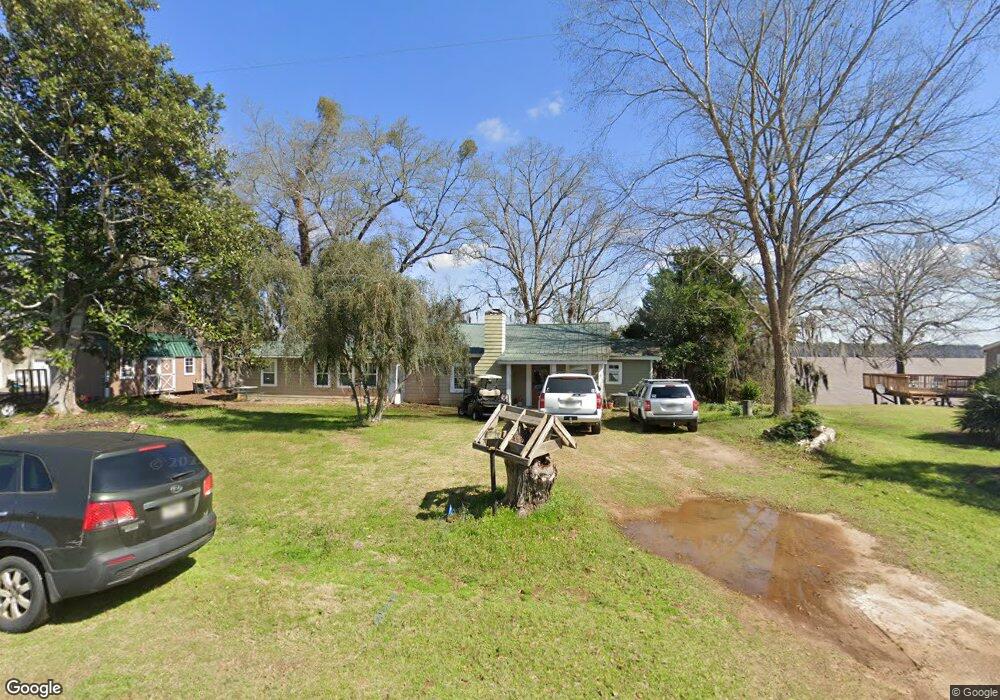
About This Home
This home is located at 260 N Spring Creek Cir, Cobb, GA 31735 and is currently estimated at $346,698, approximately $275 per square foot. 260 N Spring Creek Cir is a home located in Sumter County with nearby schools including Sumter County Primary School, Sumter County Elementary School, and Sumter County Middle School.
Ownership History
Date
Name
Owned For
Owner Type
Purchase Details
Closed on
Feb 18, 2009
Sold by
Gordon Lige P and Gordon Jessica T
Bought by
Gordon Dennis C
Current Estimated Value
Purchase Details
Closed on
Jun 11, 2007
Sold by
Gordon Dennis C
Bought by
Gordon Lige P and Gordon Jessica T
Purchase Details
Closed on
Apr 3, 2002
Sold by
Middlebrooks Anne V
Bought by
Gordon Dennis C
Purchase Details
Closed on
Sep 8, 1997
Sold by
Hamblin Wm D and Hamblin Donn
Bought by
Middlebrooks Anne V
Purchase Details
Closed on
Jun 1, 1988
Sold by
Kirk Joyce C
Bought by
Hamblin Wm D and Hamblin Donn
Purchase Details
Closed on
May 3, 1988
Sold by
Kirk James S
Bought by
Kirk Joyce C
Purchase Details
Closed on
Aug 3, 1979
Bought by
Kirk James S
Purchase Details
Closed on
Nov 25, 1942
Sold by
Mize Milton
Bought by
Weaver J M
Create a Home Valuation Report for This Property
The Home Valuation Report is an in-depth analysis detailing your home's value as well as a comparison with similar homes in the area
Home Values in the Area
Average Home Value in this Area
Purchase History
| Date | Buyer | Sale Price | Title Company |
|---|---|---|---|
| Gordon Dennis C | -- | -- | |
| Gordon Lige P | -- | -- | |
| Gordon Dennis C | $125,000 | -- | |
| Middlebrooks Anne V | $68,500 | -- | |
| Hamblin Wm D | $24,500 | -- | |
| Kirk Joyce C | -- | -- | |
| Kirk James S | $12,500 | -- | |
| Weaver J M | -- | -- |
Source: Public Records
Tax History Compared to Growth
Tax History
| Year | Tax Paid | Tax Assessment Tax Assessment Total Assessment is a certain percentage of the fair market value that is determined by local assessors to be the total taxable value of land and additions on the property. | Land | Improvement |
|---|---|---|---|---|
| 2024 | $465 | $61,692 | $41,080 | $20,612 |
| 2023 | $465 | $61,692 | $41,080 | $20,612 |
| 2022 | $465 | $61,692 | $41,080 | $20,612 |
| 2021 | $465 | $61,692 | $41,080 | $20,612 |
| 2020 | $465 | $61,692 | $41,080 | $20,612 |
| 2019 | $390 | $61,692 | $41,080 | $20,612 |
| 2018 | $390 | $61,692 | $41,080 | $20,612 |
| 2017 | $390 | $61,692 | $41,080 | $20,612 |
| 2016 | $390 | $61,692 | $41,080 | $20,612 |
| 2015 | -- | $61,892 | $38,520 | $23,372 |
| 2014 | $2,066 | $61,892 | $38,520 | $23,372 |
| 2013 | -- | $61,892 | $38,520 | $23,372 |
Source: Public Records
Map
Nearby Homes
- 252 N Spring Creek Cir
- 108 N Spring Creek Cir
- 0 N Spring Creek Cir
- TBD N Spring Creek Cir
- 170D Cantey Dr
- 113 Cypress Ln
- 115 Cypress Ln
- 152 Cantey Dr
- 114 Water Front Rd
- 151 Gary Brewer Rd
- 244 Cannon Branch Rd
- 101 Rose Ln
- 100 Valhalla
- 154 Cannon Branch Rd
- Lot # 18 Cannon Branch Rd
- Lot #35 Cannon Branch Rd
- Lot #32 Cannon Branch Rd
- Lot # 30 Cannon Branch Rd
- Lot # 17 Cannon Branch Rd
- Lot # 36 Cannon Branch Rd
- 0 Lot 5 N Spring Creek Cir Unit 57271
- 256 N Spring Creek Cir
- 264 N Spring Creek Cir
- 252 N Spring Creek Cr
- 248 N Spring Creek Cir
- 272 N Spring Creek Cir
- 244 N Spring Creek Cir
- 278 N Spring Creek Cir
- 143A N N Spring Creek Cir
- 240 N Spring Creek Cir
- 280 N Spring Creek Cir
- 238 N Spring Creek Cir
- 282 N Spring Creek Cir
- 236 N Spring Creek Cir
- 286 N Spring Creek Cir
- 288 N Spring Creek Cir
- 232 N Spring Creek Cir
- 230 N Spring Creek Cr
- 230 N Spring Creek Cir
- 294 N Spring Creek Cir