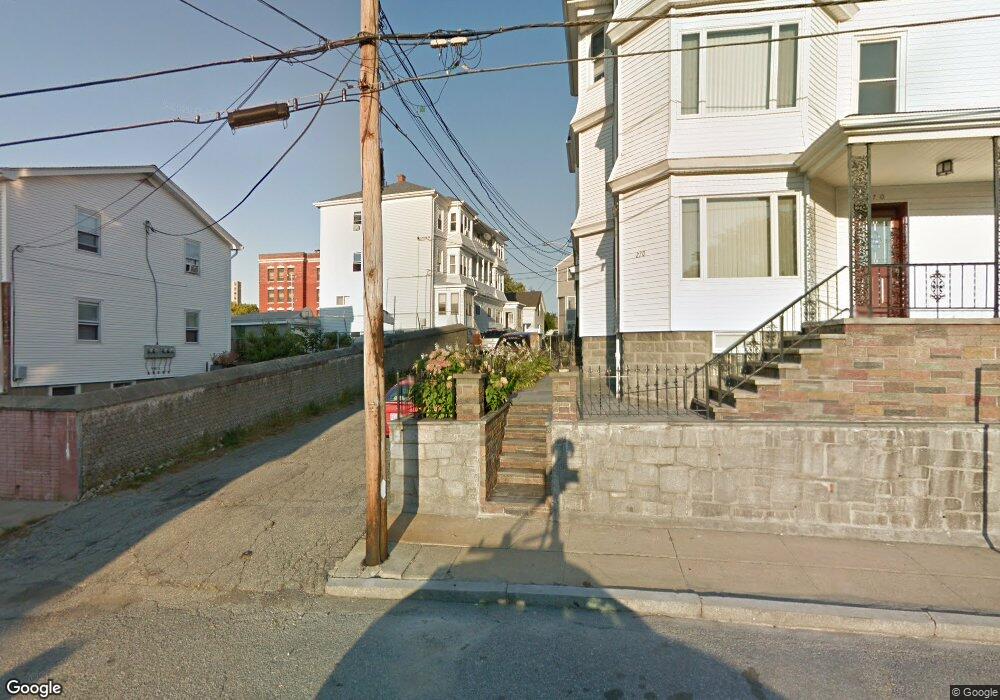
260 Pitman St Fall River, MA 02723
Flint NeighborhoodEstimated Value: $332,000 - $363,000
4
Beds
1
Bath
1,140
Sq Ft
$310/Sq Ft
Est. Value
About This Home
This home is located at 260 Pitman St, Fall River, MA 02723 and is currently estimated at $353,887, approximately $310 per square foot. 260 Pitman St is a home located in Bristol County with nearby schools including Samuel Watson, Talbot Innovation School, and B M C Durfee High School.
Ownership History
Date
Name
Owned For
Owner Type
Purchase Details
Closed on
Jun 1, 1994
Sold by
Burgess Dorothy H and Burgess John G
Bought by
Cabral Americo F and Cabral Mariana J
Current Estimated Value
Home Financials for this Owner
Home Financials are based on the most recent Mortgage that was taken out on this home.
Original Mortgage
$70,700
Interest Rate
8.49%
Mortgage Type
Purchase Money Mortgage
Create a Home Valuation Report for This Property
The Home Valuation Report is an in-depth analysis detailing your home's value as well as a comparison with similar homes in the area
Home Values in the Area
Average Home Value in this Area
Purchase History
| Date | Buyer | Sale Price | Title Company |
|---|---|---|---|
| Cabral Americo F | $74,500 | -- |
Source: Public Records
Mortgage History
| Date | Status | Borrower | Loan Amount |
|---|---|---|---|
| Open | Cabral Americo F | $67,000 | |
| Closed | Cabral Americo F | $70,700 |
Source: Public Records
Tax History Compared to Growth
Tax History
| Year | Tax Paid | Tax Assessment Tax Assessment Total Assessment is a certain percentage of the fair market value that is determined by local assessors to be the total taxable value of land and additions on the property. | Land | Improvement |
|---|---|---|---|---|
| 2025 | $3,095 | $270,300 | $106,500 | $163,800 |
| 2024 | $2,921 | $254,200 | $102,600 | $151,600 |
| 2023 | $2,618 | $213,400 | $84,700 | $128,700 |
| 2022 | $2,456 | $194,600 | $80,700 | $113,900 |
| 2021 | $2,311 | $167,100 | $76,800 | $90,300 |
| 2020 | $2,342 | $162,100 | $75,700 | $86,400 |
| 2019 | $2,248 | $154,200 | $72,900 | $81,300 |
| 2018 | $2,222 | $152,000 | $78,900 | $73,100 |
| 2017 | $2,068 | $147,700 | $75,200 | $72,500 |
| 2016 | $2,025 | $148,600 | $80,000 | $68,600 |
| 2015 | $1,944 | $148,600 | $80,000 | $68,600 |
| 2014 | $1,840 | $146,300 | $77,700 | $68,600 |
Source: Public Records
Map
Nearby Homes
- 1792 Pleasant St Unit 1808
- 383 Alden St
- 37 Eaton St
- 34 Alsop St
- 31 Choate St
- 10 Choate St
- 125 Angell St
- 215 Earle St Unit 1
- 219 Earle St Unit 3
- 217 Earle St Unit 2
- 172 Earle St
- 1498 Pleasant St
- 529 Eastern Ave
- 152 Alden St
- 71 Cash St
- 85 Reney St
- 25 Lebanon St Unit C
- 25 Lebanon St Unit D
- 89 Lafayette St
- 178 Thomas St
- 262 Pitman St
- 258 Pitman St
- 270 Pitman St
- 979 Eastern Ave
- 284 Pitman St
- 1001 Eastern Ave Unit 1w
- 1001 Eastern Ave
- 13 Edgemond St Unit 3E
- 13 Edgemond St Unit 1
- 3 Edgemond St Unit 3W
- 3 Edgemond St
- 247 Pitman St Unit 1
- 247 Pitman St Unit 2
- 19 Manning St Unit 1
- 19 Manning St Unit 1S
- 19 Manning St Unit 1 NORTH
- 19 Manning St Unit 2S
- 19 Manning St Unit 2N
- 19 Manning St Unit 2 NO
- 19 Manning St Unit 1 & 3