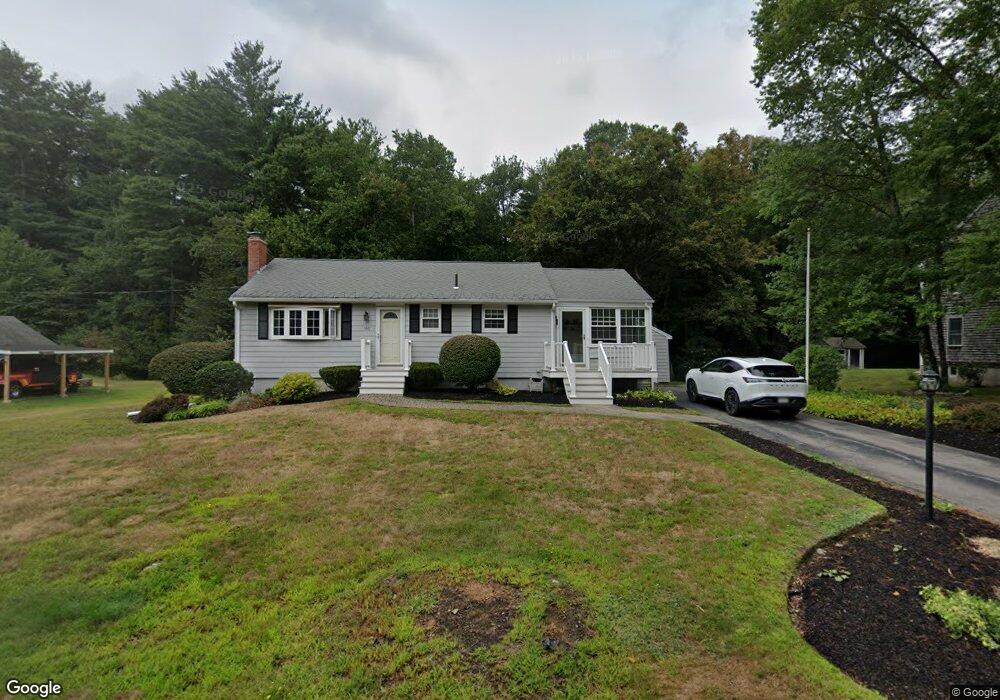
260 Plain St Hanover, MA 02339
Estimated Value: $551,000 - $598,000
3
Beds
1
Bath
1,044
Sq Ft
$554/Sq Ft
Est. Value
About This Home
This home is located at 260 Plain St, Hanover, MA 02339 and is currently estimated at $578,546, approximately $554 per square foot. 260 Plain St is a home located in Plymouth County with nearby schools including Hanover High School and The Master's Academy.
Ownership History
Date
Name
Owned For
Owner Type
Purchase Details
Closed on
Nov 17, 2025
Sold by
French Wendy A
Bought by
Wendy A Brown Rt and Brown
Current Estimated Value
Purchase Details
Closed on
Jun 17, 1998
Sold by
State St B & T Co Tr and Litton Loan Servicing
Bought by
French Wendy A
Home Financials for this Owner
Home Financials are based on the most recent Mortgage that was taken out on this home.
Original Mortgage
$112,410
Interest Rate
7.09%
Mortgage Type
Purchase Money Mortgage
Purchase Details
Closed on
Aug 20, 1997
Sold by
Colike Ft and State St B & T Co
Bought by
State St B & T Co
Create a Home Valuation Report for This Property
The Home Valuation Report is an in-depth analysis detailing your home's value as well as a comparison with similar homes in the area
Home Values in the Area
Average Home Value in this Area
Purchase History
| Date | Buyer | Sale Price | Title Company |
|---|---|---|---|
| Wendy A Brown Rt | -- | -- | |
| French Wendy A | $124,900 | -- | |
| French Wendy A | $124,900 | -- | |
| State St B & T Co | $110,500 | -- | |
| State St B & T Co | $110,500 | -- |
Source: Public Records
Mortgage History
| Date | Status | Borrower | Loan Amount |
|---|---|---|---|
| Previous Owner | State St B & T Co | $154,000 | |
| Previous Owner | State St B & T Co | $125,000 | |
| Previous Owner | State St B & T Co | $112,410 |
Source: Public Records
Tax History
| Year | Tax Paid | Tax Assessment Tax Assessment Total Assessment is a certain percentage of the fair market value that is determined by local assessors to be the total taxable value of land and additions on the property. | Land | Improvement |
|---|---|---|---|---|
| 2025 | $6,731 | $545,000 | $257,700 | $287,300 |
| 2024 | $6,998 | $545,000 | $257,700 | $287,300 |
| 2023 | $6,377 | $472,700 | $234,300 | $238,400 |
| 2022 | $6,083 | $398,900 | $222,600 | $176,300 |
| 2021 | $32,217 | $352,000 | $181,100 | $170,900 |
| 2020 | $6,717 | $358,000 | $191,700 | $166,300 |
| 2019 | $5,568 | $339,300 | $191,700 | $147,600 |
| 2018 | $5,423 | $333,100 | $191,700 | $141,400 |
| 2017 | $5,167 | $312,800 | $183,400 | $129,400 |
| 2016 | $4,992 | $296,100 | $166,700 | $129,400 |
| 2015 | $4,338 | $268,600 | $154,500 | $114,100 |
Source: Public Records
Map
Nearby Homes
- 506 Main St
- 62 Larchmont Ln
- 36 Grove St
- 561 Circuit St
- 250 Center St
- 51 Cervelli Farm Dr
- 37 Dr
- 23 Cervelli Farm Dr
- 38 Cervelli Farm Dr
- 9 Cervelli Farm Dr
- 75 School St
- 44 Stone Meadow Ln
- 47 Stone Meadow Ln
- 776 Main St
- 95 Tecumseh Dr
- 823 Market St
- 36 Bayberry Ln
- 53 Chestnut St
- 73 Shingle Mill Ln
- 50 Village Ln
Your Personal Tour Guide
Ask me questions while you tour the home.