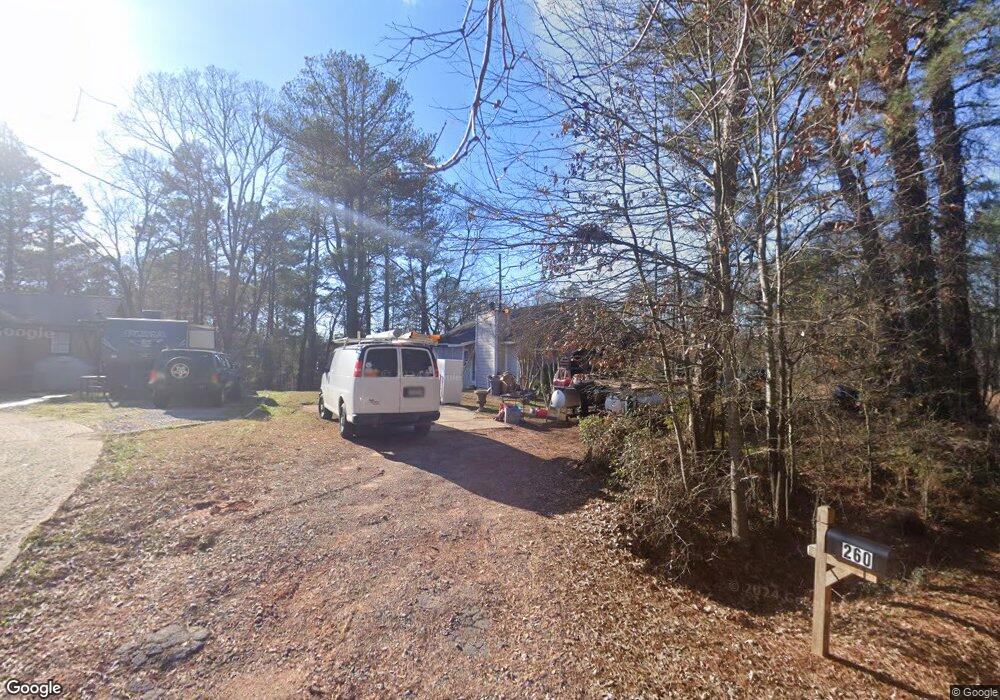
260 Pugh St Buford, GA 30518
Estimated Value: $268,636 - $287,000
3
Beds
1
Bath
1,040
Sq Ft
$267/Sq Ft
Est. Value
About This Home
This home is located at 260 Pugh St, Buford, GA 30518 and is currently estimated at $277,409, approximately $266 per square foot. 260 Pugh St is a home located in Gwinnett County with nearby schools including Buford Elementary School, Buford Senior Academy, and Buford Academy.
Ownership History
Date
Name
Owned For
Owner Type
Purchase Details
Closed on
Feb 13, 2013
Sold by
Level Path Investment Grp
Bought by
Jennings Carolyn and Jennings James
Current Estimated Value
Purchase Details
Closed on
Feb 6, 2004
Sold by
Brand David S
Bought by
Jennings James and Jennings Carolyn
Home Financials for this Owner
Home Financials are based on the most recent Mortgage that was taken out on this home.
Original Mortgage
$76,500
Interest Rate
5.85%
Mortgage Type
New Conventional
Create a Home Valuation Report for This Property
The Home Valuation Report is an in-depth analysis detailing your home's value as well as a comparison with similar homes in the area
Home Values in the Area
Average Home Value in this Area
Purchase History
| Date | Buyer | Sale Price | Title Company |
|---|---|---|---|
| Jennings Carolyn | -- | -- | |
| Jennings James | $85,000 | -- |
Source: Public Records
Mortgage History
| Date | Status | Borrower | Loan Amount |
|---|---|---|---|
| Previous Owner | Jennings James | $76,500 |
Source: Public Records
Tax History Compared to Growth
Tax History
| Year | Tax Paid | Tax Assessment Tax Assessment Total Assessment is a certain percentage of the fair market value that is determined by local assessors to be the total taxable value of land and additions on the property. | Land | Improvement |
|---|---|---|---|---|
| 2025 | $1,351 | $94,120 | $40,000 | $54,120 |
| 2024 | $1,310 | $91,280 | $33,600 | $57,680 |
| 2023 | $1,310 | $67,600 | $26,000 | $41,600 |
| 2022 | $970 | $67,600 | $26,000 | $41,600 |
| 2021 | $618 | $43,080 | $16,800 | $26,280 |
| 2020 | $618 | $43,080 | $16,800 | $26,280 |
| 2019 | $558 | $43,080 | $16,800 | $26,280 |
| 2018 | $323 | $24,920 | $5,600 | $19,320 |
| 2016 | $319 | $24,920 | $5,600 | $19,320 |
| 2015 | $331 | $24,920 | $5,600 | $19,320 |
| 2014 | -- | $23,480 | $5,600 | $17,880 |
Source: Public Records
Map
Nearby Homes
- 4993 Glencliff Dr
- 155 Rowe St
- 120 Poplar St
- 175 Old Swimming Pool Rd
- 1567 Maplecliff Way
- 619 Garner St
- 150 Wilbanks St
- 140 Wilbanks St
- 510 Jackson St
- 490 Jackson St
- 4862 White St
- The Murphy Plan at White Street
- 4864 White St
- 399 Jackson St
- 4860 White St
- 1230 Ainsworth Alley Unit Lot 34
- 1242 Ainsworth Alley Unit Lot 40