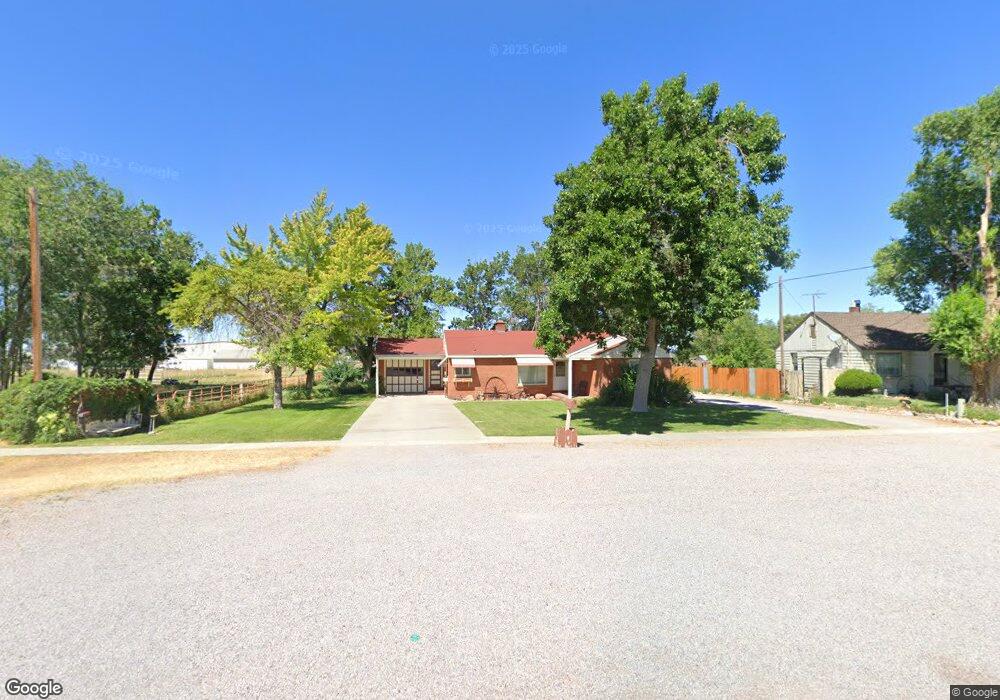
260 S 300 W Fillmore, UT 84631
Estimated Value: $287,000 - $359,000
--
Bed
--
Bath
--
Sq Ft
1.26
Acres
About This Home
This home is located at 260 S 300 W, Fillmore, UT 84631 and is currently estimated at $317,824. 260 S 300 W is a home.
Ownership History
Date
Name
Owned For
Owner Type
Purchase Details
Closed on
Feb 29, 2016
Sold by
Mitchell Steve G
Bought by
Mitchell Steve G and Mitchell Gail N
Current Estimated Value
Purchase Details
Closed on
Apr 26, 2013
Sold by
Mitchell Gail N and Mtchell Paul J
Bought by
Mitchell Steve G
Home Financials for this Owner
Home Financials are based on the most recent Mortgage that was taken out on this home.
Original Mortgage
$95,200
Outstanding Balance
$67,180
Interest Rate
3.54%
Mortgage Type
New Conventional
Estimated Equity
$250,644
Create a Home Valuation Report for This Property
The Home Valuation Report is an in-depth analysis detailing your home's value as well as a comparison with similar homes in the area
Home Values in the Area
Average Home Value in this Area
Purchase History
| Date | Buyer | Sale Price | Title Company |
|---|---|---|---|
| Mitchell Steve G | -- | First American Title | |
| Mitchell Steve G | -- | -- |
Source: Public Records
Mortgage History
| Date | Status | Borrower | Loan Amount |
|---|---|---|---|
| Open | Mitchell Steve G | $95,200 |
Source: Public Records
Tax History Compared to Growth
Tax History
| Year | Tax Paid | Tax Assessment Tax Assessment Total Assessment is a certain percentage of the fair market value that is determined by local assessors to be the total taxable value of land and additions on the property. | Land | Improvement |
|---|---|---|---|---|
| 2025 | $1,364 | $171,252 | $50,820 | $120,432 |
| 2024 | $1,364 | $154,585 | $45,029 | $109,556 |
| 2023 | $1,659 | $154,585 | $45,029 | $109,556 |
| 2022 | $1,300 | $116,745 | $42,079 | $74,666 |
| 2021 | $1,080 | $93,102 | $27,325 | $65,777 |
| 2020 | $996 | $86,350 | $24,840 | $61,510 |
| 2019 | $874 | $76,062 | $24,840 | $51,222 |
| 2018 | $838 | $74,617 | $24,840 | $49,777 |
| 2017 | $764 | $64,633 | $24,840 | $39,793 |
| 2016 | $730 | $64,633 | $24,840 | $39,793 |
| 2015 | $731 | $64,633 | $24,840 | $39,793 |
| 2014 | -- | $64,633 | $24,840 | $39,793 |
| 2013 | -- | $64,633 | $24,840 | $39,793 |
Source: Public Records
Map
Nearby Homes