Estimated Value: $222,000 - $256,000
3
Beds
2
Baths
1,215
Sq Ft
$194/Sq Ft
Est. Value
About This Home
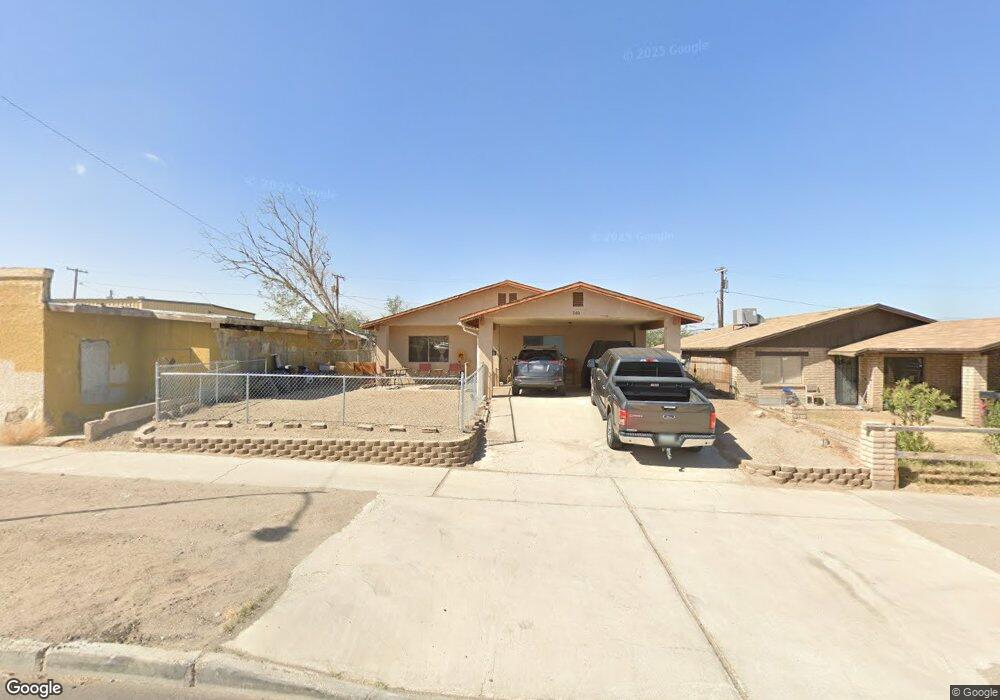
This home is located at 260 S 5th Ave, Yuma, AZ 85364 and is currently estimated at $235,781, approximately $194 per square foot. 260 S 5th Ave is a home located in Yuma County with nearby schools including Roosevelt School, Fourth Avenue Junior High School, and Yuma High School.
Ownership History
Date
Name
Owned For
Owner Type
Purchase Details
Closed on
Jan 15, 2010
Sold by
Rojas Felicitas
Bought by
Rojas Cidronio R and Rojas Maria C
Current Estimated Value
Purchase Details
Closed on
Oct 19, 2009
Sold by
Rojas Cidronio R
Bought by
Rojas Felicitas
Purchase Details
Closed on
Nov 24, 2008
Sold by
Rojas Cidronio R and Rojas Maria C
Bought by
Rojas Cidronio R
Purchase Details
Closed on
Jan 25, 2007
Sold by
Rojas Felicitas and Ordaz Alejandra
Bought by
Rojas Cidronio R and Rojas Maria C
Purchase Details
Closed on
Jan 10, 2007
Sold by
Geronimo Israel
Bought by
Rojas Felicitas
Create a Home Valuation Report for This Property
The Home Valuation Report is an in-depth analysis detailing your home's value as well as a comparison with similar homes in the area
Home Values in the Area
Average Home Value in this Area
Purchase History
| Date | Buyer | Sale Price | Title Company |
|---|---|---|---|
| Rojas Cidronio R | -- | None Available | |
| Rojas Felicitas | -- | None Available | |
| Rojas Cidronio R | -- | None Available | |
| Rojas Cidronio R | -- | None Available | |
| Rojas Felicitas | -- | None Available | |
| Rojas Felicitas | -- | None Available | |
| Ordaz Alejandra | -- | None Available |
Source: Public Records
Tax History Compared to Growth
Tax History
| Year | Tax Paid | Tax Assessment Tax Assessment Total Assessment is a certain percentage of the fair market value that is determined by local assessors to be the total taxable value of land and additions on the property. | Land | Improvement |
|---|---|---|---|---|
| 2025 | $366 | $8,353 | $1,892 | $6,461 |
| 2024 | $348 | $7,956 | $1,842 | $6,114 |
| 2023 | $348 | $7,576 | $1,917 | $5,659 |
| 2022 | $333 | $7,216 | $2,014 | $5,202 |
| 2021 | $338 | $6,872 | $1,868 | $5,004 |
| 2020 | $437 | $6,545 | $1,583 | $4,962 |
| 2019 | $413 | $6,234 | $1,657 | $4,577 |
| 2018 | $376 | $5,937 | $1,568 | $4,369 |
| 2017 | $344 | $5,937 | $1,568 | $4,369 |
| 2016 | $352 | $5,385 | $1,216 | $4,169 |
| 2015 | $277 | $5,129 | $1,357 | $3,772 |
| 2014 | $277 | $4,884 | $1,500 | $3,384 |
Source: Public Records
Map
Nearby Homes