Estimated Value: $647,000 - $942,000
4
Beds
3
Baths
2,646
Sq Ft
$295/Sq Ft
Est. Value
About This Home
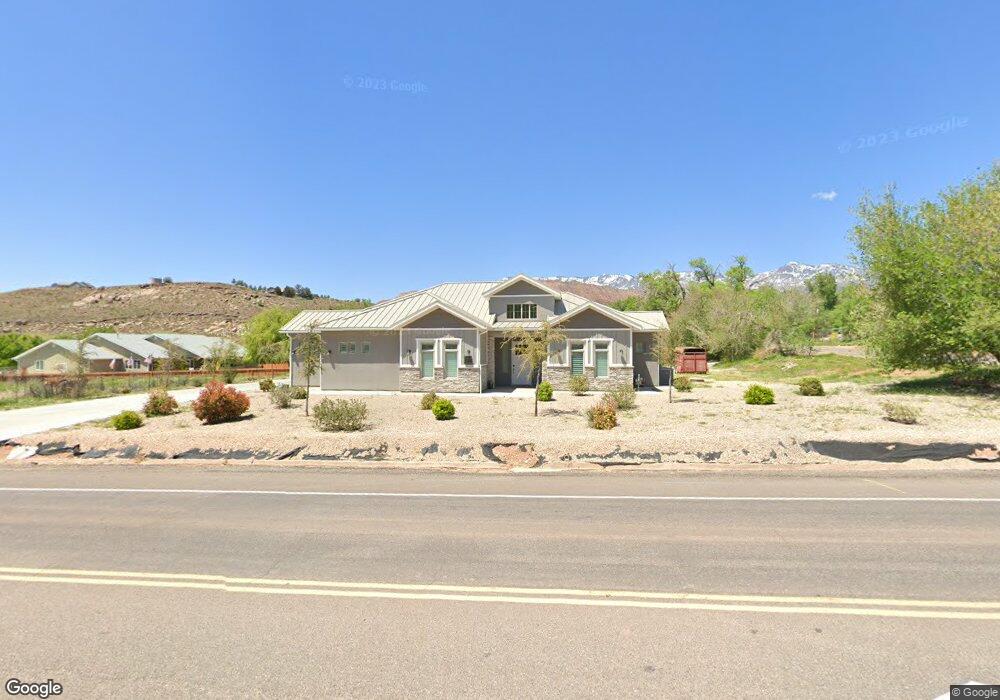
This home is located at 260 S Main St, Leeds, UT 84746 and is currently estimated at $780,343, approximately $294 per square foot. 260 S Main St is a home with nearby schools including Coral Canyon School, Pine View Middle School, and Fossil Ridge Intermediate School.
Ownership History
Date
Name
Owned For
Owner Type
Purchase Details
Closed on
Aug 29, 2025
Sold by
Sullivan Tyson and Sullivan Aubree
Bought by
Tyson And Aubree Sullivan Family Trust and Sullivan
Current Estimated Value
Purchase Details
Closed on
Mar 27, 2020
Sold by
Sullivan Tyson
Bought by
Sullivan Tyson and Sullivan Aubree
Home Financials for this Owner
Home Financials are based on the most recent Mortgage that was taken out on this home.
Original Mortgage
$265,000
Interest Rate
3.4%
Mortgage Type
New Conventional
Purchase Details
Closed on
Feb 7, 2017
Sold by
Pacific Sand Inc
Bought by
Sullivan Tyson
Home Financials for this Owner
Home Financials are based on the most recent Mortgage that was taken out on this home.
Original Mortgage
$19,000
Interest Rate
4.32%
Mortgage Type
Unknown
Purchase Details
Closed on
Nov 12, 2010
Sold by
Pines West Holdings Llc
Bought by
Pacific Sand Inc
Create a Home Valuation Report for This Property
The Home Valuation Report is an in-depth analysis detailing your home's value as well as a comparison with similar homes in the area
Home Values in the Area
Average Home Value in this Area
Purchase History
| Date | Buyer | Sale Price | Title Company |
|---|---|---|---|
| Tyson And Aubree Sullivan Family Trust | -- | None Listed On Document | |
| Sullivan Tyson | -- | Vanguard Title Ins Agcy Llc | |
| Sullivan Tyson | -- | Title Of Utah Inc | |
| Pacific Sand Inc | -- | First Title Of Utah |
Source: Public Records
Mortgage History
| Date | Status | Borrower | Loan Amount |
|---|---|---|---|
| Previous Owner | Sullivan Tyson | $265,000 | |
| Previous Owner | Sullivan Tyson | $19,000 |
Source: Public Records
Tax History Compared to Growth
Tax History
| Year | Tax Paid | Tax Assessment Tax Assessment Total Assessment is a certain percentage of the fair market value that is determined by local assessors to be the total taxable value of land and additions on the property. | Land | Improvement |
|---|---|---|---|---|
| 2025 | $2,594 | $371,415 | $52,250 | $319,165 |
| 2023 | $2,778 | $396,000 | $52,250 | $343,750 |
| 2022 | $2,729 | $365,970 | $47,025 | $318,945 |
| 2021 | $2,485 | $493,900 | $71,300 | $422,600 |
| 2020 | $2,504 | $466,400 | $71,300 | $395,100 |
| 2019 | $705 | $70,000 | $70,000 | $0 |
| 2018 | $698 | $65,000 | $0 | $0 |
| 2017 | $447 | $40,000 | $0 | $0 |
| 2016 | $459 | $40,000 | $0 | $0 |
| 2015 | $431 | $35,000 | $0 | $0 |
| 2014 | $428 | $35,000 | $0 | $0 |
Source: Public Records
Map
Nearby Homes
- 376 S Main St
- 190 W Shinarump Cir
- 95 W Center St
- 226 W Shinarump Cir
- 214 W Shinarump Cir
- 245 Mesa View Ave
- 0 Mesa View Ave
- 89 E Vista Ave
- 230 Boulder Way
- 0 Parcel: L-See-1 Unit 25-267177
- 0 Parcel: L-See-4 Unit 25-267319
- 0 Parcel: L-See-6 Unit 25-267324
- 0 Parcel: L-See-3 Unit 25-267317
- 0 Parcel: L-See-2 Unit 25-267310
- 0 Unit 25-267349
- 0 Unit 25-267322
- 0 Parcel: L-See-10 Unit 25-267339
- 0 Parcel: L-See-13 Unit 25-267474
- 0 Parcel: L-See-7 Unit 25-267335
- 0 Parcel: L-See-14 Unit 25-267352
- 15 Cemetery Rd
- 47 S Main St Unit 1
- Main St S Main St
- 123 S Main St
- 0 S Main St
- 47 S Main St
- 20 W Pecan Ln
- 255 S Main St
- 235 S Main St
- 30 W Pecan Ln
- 34 W Pecan Ln
- 60 W Pecan Ln
- 50 W Pecan Ln
- 225 S Main St
- 59 W Mulberry Ln
- 310 S Main St
- 35 W Pecan Ln Unit 1
- 217 S Main St
- 80 W Pecan Ln
- 89 W Mulberry Ln