Estimated Value: $257,000 - $300,000
--
Bed
--
Bath
1,985
Sq Ft
$137/Sq Ft
Est. Value
About This Home
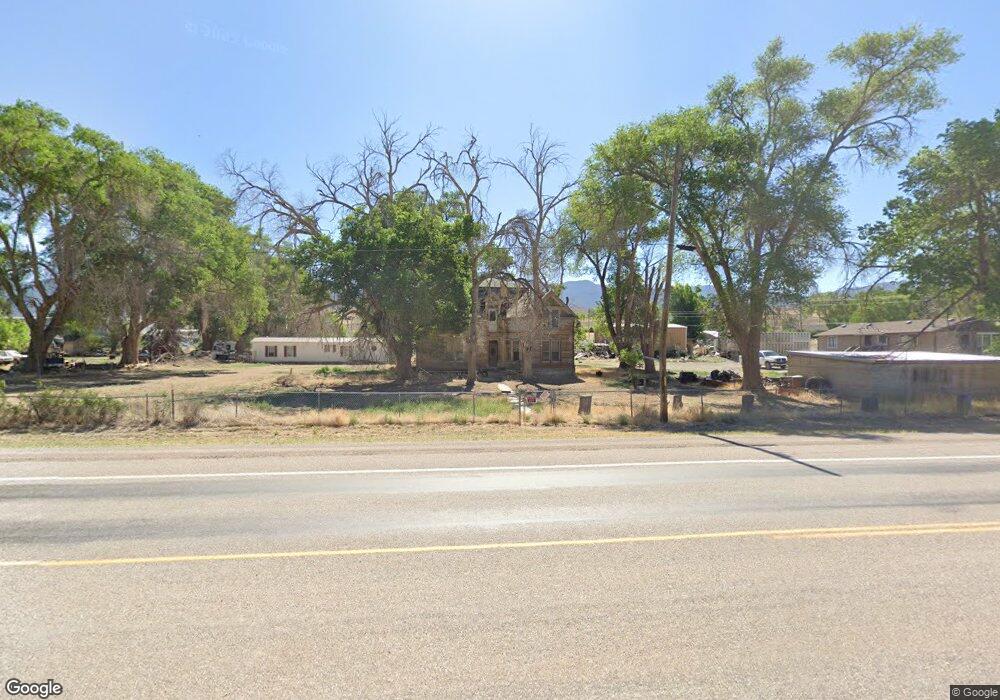
This home is located at 260 S Main St, Lund, NV 89317 and is currently estimated at $272,667, approximately $137 per square foot. 260 S Main St is a home with nearby schools including Lund High School.
Ownership History
Date
Name
Owned For
Owner Type
Purchase Details
Closed on
May 22, 2007
Sold by
Reid Max Gordon and Reid Mollie Kaye
Bought by
Reid Max Gordon and Reid Charie
Current Estimated Value
Home Financials for this Owner
Home Financials are based on the most recent Mortgage that was taken out on this home.
Original Mortgage
$47,000
Interest Rate
6.12%
Purchase Details
Closed on
May 14, 2007
Sold by
Reid Max Gordon and Reid Mollie Kaye
Bought by
Reid Max Gordon and Reid Cherie Michelle
Home Financials for this Owner
Home Financials are based on the most recent Mortgage that was taken out on this home.
Original Mortgage
$47,000
Interest Rate
6.12%
Create a Home Valuation Report for This Property
The Home Valuation Report is an in-depth analysis detailing your home's value as well as a comparison with similar homes in the area
Home Values in the Area
Average Home Value in this Area
Purchase History
| Date | Buyer | Sale Price | Title Company |
|---|---|---|---|
| Reid Max Gordon | -- | Lawyers Title Of Nevada Inc | |
| Reid Max Gordon | -- | -- |
Source: Public Records
Mortgage History
| Date | Status | Borrower | Loan Amount |
|---|---|---|---|
| Closed | Reid Max Gordon | $47,000 |
Source: Public Records
Tax History Compared to Growth
Tax History
| Year | Tax Paid | Tax Assessment Tax Assessment Total Assessment is a certain percentage of the fair market value that is determined by local assessors to be the total taxable value of land and additions on the property. | Land | Improvement |
|---|---|---|---|---|
| 2025 | $1,048 | $30,873 | $2,643 | $28,230 |
| 2024 | $1,048 | $30,529 | $2,359 | $28,170 |
| 2023 | $1,048 | $27,071 | $1,808 | $25,263 |
| 2022 | $904 | $23,703 | $1,808 | $21,895 |
| 2021 | $852 | $22,283 | $1,808 | $20,475 |
| 2020 | $854 | $22,816 | $1,739 | $21,077 |
| 2019 | $855 | $21,856 | $1,739 | $20,117 |
| 2018 | $832 | $21,070 | $1,739 | $19,331 |
| 2017 | $821 | $20,764 | $1,739 | $19,025 |
| 2016 | $813 | $32,927 | $1,592 | $31,335 |
| 2015 | $990 | $33,084 | $1,592 | $31,492 |
| 2014 | $990 | $32,947 | $1,612 | $31,335 |
Source: Public Records
Map
Nearby Homes