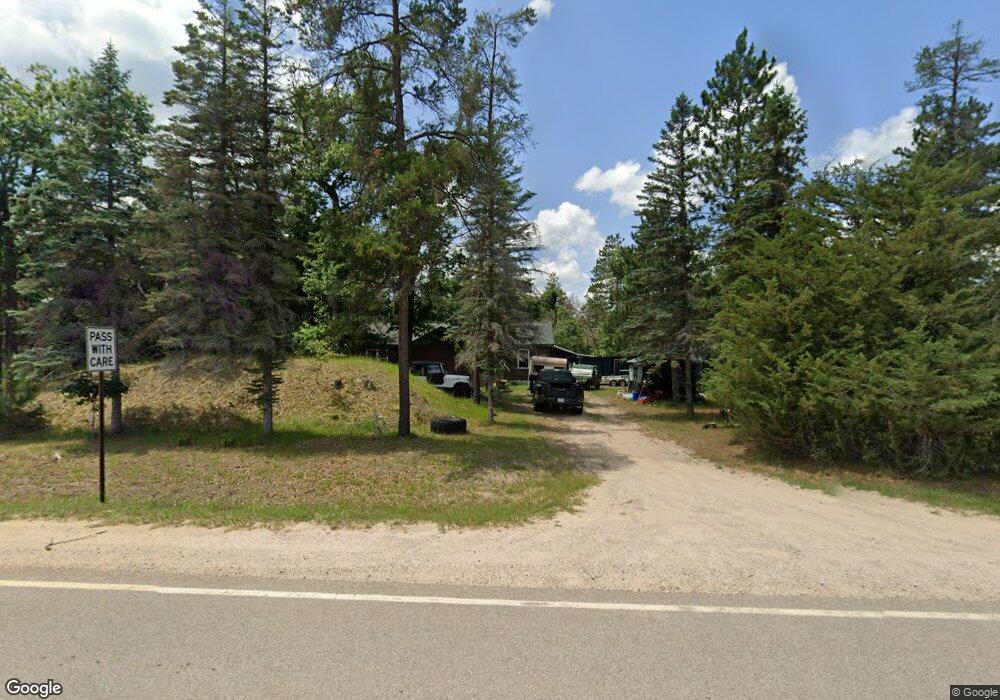
260 S Wakeley Bridge Rd Grayling, MI 49738
Estimated Value: $220,108 - $307,000
2
Beds
1
Bath
1,572
Sq Ft
$172/Sq Ft
Est. Value
About This Home
This home is located at 260 S Wakeley Bridge Rd, Grayling, MI 49738 and is currently estimated at $269,777, approximately $171 per square foot. 260 S Wakeley Bridge Rd is a home located in Crawford County with nearby schools including Grayling Elementary School, Grayling Middle School, and Grayling High School.
Ownership History
Date
Name
Owned For
Owner Type
Purchase Details
Closed on
Jun 4, 2021
Sold by
Benstead Gerald E
Bought by
Benstead Gerald E and Martin Richard
Current Estimated Value
Home Financials for this Owner
Home Financials are based on the most recent Mortgage that was taken out on this home.
Original Mortgage
$78,500
Interest Rate
2.9%
Mortgage Type
New Conventional
Purchase Details
Closed on
Mar 26, 2002
Sold by
Bennett Betty Svr Jess
Bought by
Benstead Gerald and Benstead Darlene
Purchase Details
Closed on
Oct 3, 1988
Sold by
Bennett Betty
Bought by
Benstead Gerald and Benstead Darlene
Purchase Details
Closed on
Jan 28, 1986
Sold by
Peterson Daniel and Peterson Denise
Bought by
Bennett Jess
Purchase Details
Closed on
Sep 1, 1984
Sold by
Bennett Jess and Bennett Betty
Bought by
Peterson Daniel A
Purchase Details
Closed on
Aug 29, 1984
Sold by
Bennett Jess and Bennett Betty
Bought by
Bennett Jess and Bennett Betty
Purchase Details
Closed on
Apr 6, 1984
Sold by
Bennett Jesse W
Bought by
Bennett Jess
Create a Home Valuation Report for This Property
The Home Valuation Report is an in-depth analysis detailing your home's value as well as a comparison with similar homes in the area
Home Values in the Area
Average Home Value in this Area
Purchase History
| Date | Buyer | Sale Price | Title Company |
|---|---|---|---|
| Benstead Gerald E | -- | -- | |
| Benstead Gerald | $35,000 | -- | |
| Benstead Gerald | $35,500 | -- | |
| Bennett Jess | -- | -- | |
| Peterson Daniel A | $30,000 | -- | |
| Bennett Jess | -- | -- | |
| Bennett Jess | -- | -- |
Source: Public Records
Mortgage History
| Date | Status | Borrower | Loan Amount |
|---|---|---|---|
| Previous Owner | Benstead Gerald E | $78,500 |
Source: Public Records
Tax History Compared to Growth
Tax History
| Year | Tax Paid | Tax Assessment Tax Assessment Total Assessment is a certain percentage of the fair market value that is determined by local assessors to be the total taxable value of land and additions on the property. | Land | Improvement |
|---|---|---|---|---|
| 2025 | $1,240 | $100,200 | $2,200 | $98,000 |
| 2024 | $744 | $97,300 | $2,200 | $95,100 |
| 2023 | $711 | $80,900 | $2,200 | $78,700 |
| 2022 | $677 | $71,300 | $2,200 | $69,100 |
| 2021 | $1,052 | $66,400 | $2,200 | $64,200 |
| 2020 | $1,039 | $64,700 | $2,200 | $62,500 |
| 2019 | $1,015 | $54,700 | $2,200 | $52,500 |
| 2018 | $999 | $49,000 | $2,200 | $46,800 |
| 2017 | $689 | $54,200 | $2,200 | $52,000 |
| 2016 | $683 | $48,700 | $2,200 | $46,500 |
| 2015 | $954 | $48,700 | $0 | $0 |
| 2014 | -- | $45,100 | $0 | $0 |
| 2013 | -- | $44,500 | $0 | $0 |
Source: Public Records
Map
Nearby Homes
- 0 N Wakeley Bridge Rd Unit 201828736
- 3853 Grove St
- 0 Killeen Trail Unit 1938380
- V/L 10AC Killeen Trail
- 3935 Tara Ln
- 2969 Cambay Trail
- 1840 Shaw Park Rd
- 5477 and 5466 Pershing Place
- 5589 Pershing Place
- 5605 Pershing Place
- 2741 E M-72 Hwy
- 2741 E M 72 Hwy
- 3224 E M-72 Hwy
- 3048 S Wakeley Bridge Rd
- 1952 S Stephan Bridge Rd
- 3386 Chase Bridge Rd
- 2466 Sunset Strip
- 4240 Diamond Dr
- 269 Dixson Dr
- 351 Michigan 72
- 280 S Wakeley Bridge Rd
- 212 S Wakeley Bridge Rd
- 316 S Wakeley Bridge Rd
- 178 S Wakeley Bridge Rd
- 3916 Merrie Ln
- 3913 Merrie Ln
- 0 Merrie Ln Unit (4.19 Acres) 260639
- 0 Merrie Ln
- 3630 Merrie Ln
- 146 S Wakeley Bridge Rd
- 362 S Wakeley Bridge Rd
- 3859 Merrie Ln
- 3866 Merrie Ln
- 3836 Merrie Ln
- 3972 E North Down River Rd
- 3930 E North Down River Rd
- 3902 E North Down River Rd
- 3741 Merrie Ln
- 3860 E North Down River Rd
- 3828 E North Down River Rd