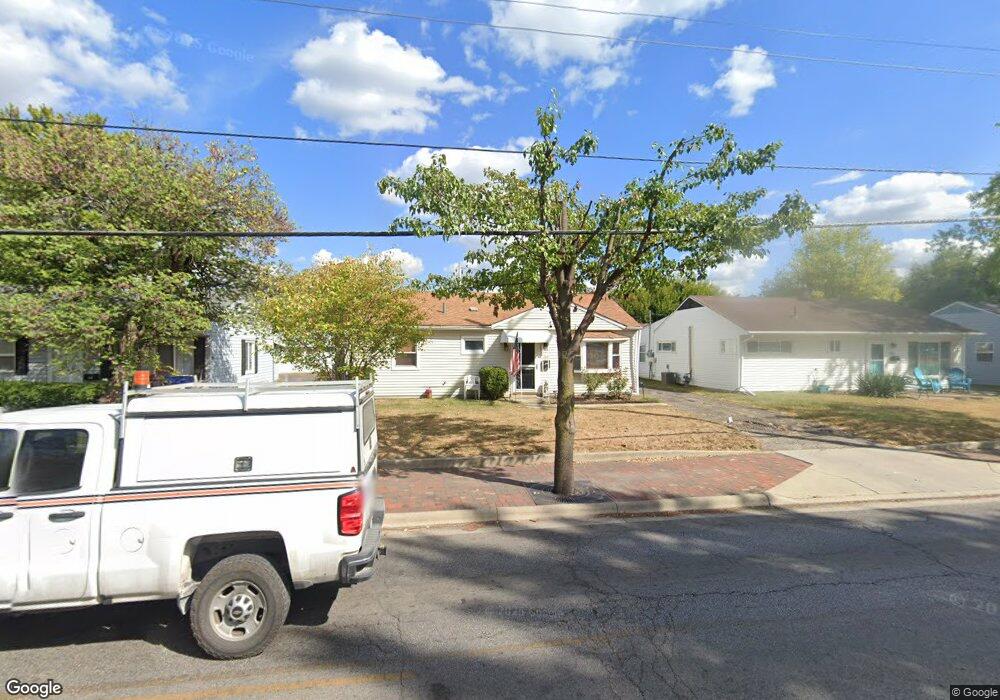
260 S Yearling Rd Columbus, OH 43213
Estimated Value: $185,000 - $220,000
3
Beds
1
Bath
1,043
Sq Ft
$191/Sq Ft
Est. Value
About This Home
This home is located at 260 S Yearling Rd, Columbus, OH 43213 and is currently estimated at $199,403, approximately $191 per square foot. 260 S Yearling Rd is a home located in Franklin County with nearby schools including Etna Road Elementary School, Beechwood Elementary School, and Rosemore Middle School.
Ownership History
Date
Name
Owned For
Owner Type
Purchase Details
Closed on
Jul 24, 2011
Sold by
Parshall Mark C
Bought by
Lewis Travis L
Current Estimated Value
Home Financials for this Owner
Home Financials are based on the most recent Mortgage that was taken out on this home.
Original Mortgage
$72,124
Outstanding Balance
$51,872
Interest Rate
5.5%
Mortgage Type
FHA
Estimated Equity
$147,531
Purchase Details
Closed on
Jul 14, 2000
Sold by
Kilby Sharon Lee
Bought by
Parshall Mark C
Home Financials for this Owner
Home Financials are based on the most recent Mortgage that was taken out on this home.
Original Mortgage
$84,975
Interest Rate
8.31%
Mortgage Type
VA
Purchase Details
Closed on
Jul 6, 1998
Sold by
Rutherford Susan D
Bought by
Kilby Sharon Lee
Home Financials for this Owner
Home Financials are based on the most recent Mortgage that was taken out on this home.
Original Mortgage
$68,507
Interest Rate
7.17%
Mortgage Type
FHA
Purchase Details
Closed on
Sep 7, 1995
Sold by
Frabott Richard Allen
Bought by
Susan D Rutherford
Home Financials for this Owner
Home Financials are based on the most recent Mortgage that was taken out on this home.
Original Mortgage
$67,250
Interest Rate
7.76%
Mortgage Type
New Conventional
Purchase Details
Closed on
Apr 1, 1986
Create a Home Valuation Report for This Property
The Home Valuation Report is an in-depth analysis detailing your home's value as well as a comparison with similar homes in the area
Home Values in the Area
Average Home Value in this Area
Purchase History
| Date | Buyer | Sale Price | Title Company |
|---|---|---|---|
| Lewis Travis L | $74,000 | None Available | |
| Parshall Mark C | $82,500 | Stewart Title Agency Of Ohio | |
| Kilby Sharon Lee | $70,000 | Chicago Title | |
| Susan D Rutherford | $67,900 | -- | |
| -- | $42,900 | -- |
Source: Public Records
Mortgage History
| Date | Status | Borrower | Loan Amount |
|---|---|---|---|
| Open | Lewis Travis L | $72,124 | |
| Previous Owner | Parshall Mark C | $84,975 | |
| Previous Owner | Kilby Sharon Lee | $68,507 | |
| Previous Owner | Susan D Rutherford | $67,250 |
Source: Public Records
Tax History Compared to Growth
Tax History
| Year | Tax Paid | Tax Assessment Tax Assessment Total Assessment is a certain percentage of the fair market value that is determined by local assessors to be the total taxable value of land and additions on the property. | Land | Improvement |
|---|---|---|---|---|
| 2024 | $2,365 | $54,090 | $13,660 | $40,430 |
| 2023 | $2,348 | $54,075 | $13,650 | $40,425 |
| 2022 | $1,609 | $28,180 | $5,250 | $22,930 |
| 2021 | $1,511 | $28,180 | $5,250 | $22,930 |
| 2020 | $1,496 | $28,180 | $5,250 | $22,930 |
| 2019 | $1,377 | $22,540 | $4,200 | $18,340 |
| 2018 | $1,394 | $22,540 | $4,200 | $18,340 |
| 2017 | $1,352 | $22,540 | $4,200 | $18,340 |
| 2016 | $1,374 | $21,040 | $3,960 | $17,080 |
| 2015 | $1,386 | $21,040 | $3,960 | $17,080 |
| 2014 | $1,386 | $21,040 | $3,960 | $17,080 |
| 2013 | $733 | $23,380 | $4,410 | $18,970 |
Source: Public Records
Map
Nearby Homes
- 4368 Broadhurst Dr
- 4148 Elbern Ave
- 4489 Saint Margaret Ln
- 4572 Saint Anthony Ln
- 451 Beaver Ave
- 579 Westphal Ave
- 571 S Hamilton Rd
- 91 Robinwood Ave
- 353 Shell Ct E
- 3814 Elbern Ave
- 4653 Kae Ave
- 320 Collingwood Ave
- 469 Cumberland Dr
- 798 S Yearling Rd
- 424 Cumberland Dr
- 4780 Etna Rd Unit 782
- 4662 Jae Ave
- 526 Collingwood Ave
- 4094 E Main St
- 322 Fairway Cir
- 252 S Yearling Rd
- 266 S Yearling Rd
- 272 S Yearling Rd
- 246 S Yearling Rd
- 265 Saint Christopher Ln
- 257 Saint Christopher Ln
- 240 S Yearling Rd
- 278 S Yearling Rd
- 271 Saint Christopher Ln
- 271 Saint Christopher Ln Unit L
- 251 Saint Christopher Ln
- 243 S Yearling Rd Unit 245
- 245 St Christopher Ln
- 251 S Yearling Rd Unit 253
- 245 Saint Christopher Ln
- 286 S Yearling Rd
- 4360 Lafayette Ct
- 239 Saint Christopher Ln
- 231 S Yearling Rd Unit 233
- 4356 Lafayette Ct