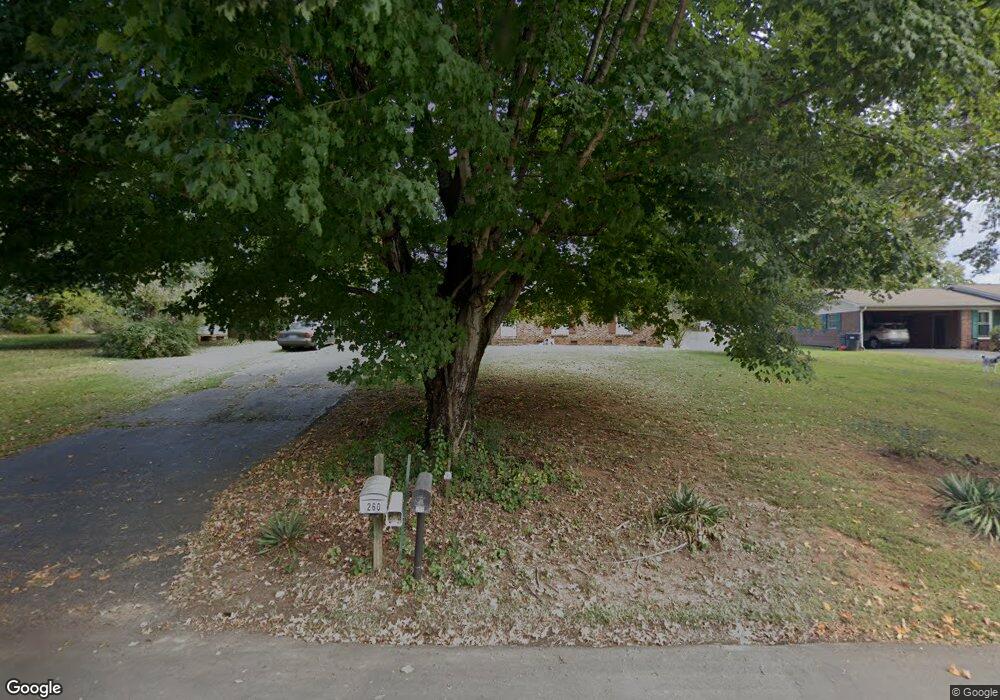
260 Saint Jill Cir Statesville, NC 28625
Estimated Value: $231,000 - $251,000
3
Beds
2
Baths
1,260
Sq Ft
$193/Sq Ft
Est. Value
About This Home
This home is located at 260 Saint Jill Cir, Statesville, NC 28625 and is currently estimated at $243,482, approximately $193 per square foot. 260 Saint Jill Cir is a home located in Iredell County with nearby schools including Scotts Elementary School, West Iredell Middle School, and West Iredell High School.
Ownership History
Date
Name
Owned For
Owner Type
Purchase Details
Closed on
Nov 27, 2018
Sold by
Jakubowski Adam J and Jakubowski Agnes
Bought by
Hollada Brandon D and Hollada Maria R
Current Estimated Value
Home Financials for this Owner
Home Financials are based on the most recent Mortgage that was taken out on this home.
Original Mortgage
$117,000
Outstanding Balance
$103,224
Interest Rate
4.87%
Mortgage Type
Adjustable Rate Mortgage/ARM
Estimated Equity
$140,258
Purchase Details
Closed on
Dec 20, 2002
Sold by
Bunton Tammy I
Bought by
Jakubowski Thomas J and Jakubowski Adam J
Home Financials for this Owner
Home Financials are based on the most recent Mortgage that was taken out on this home.
Original Mortgage
$50,000
Interest Rate
6.07%
Purchase Details
Closed on
Feb 1, 1992
Purchase Details
Closed on
Feb 1, 1990
Purchase Details
Closed on
Aug 1, 1989
Purchase Details
Closed on
Jun 1, 1985
Create a Home Valuation Report for This Property
The Home Valuation Report is an in-depth analysis detailing your home's value as well as a comparison with similar homes in the area
Home Values in the Area
Average Home Value in this Area
Purchase History
| Date | Buyer | Sale Price | Title Company |
|---|---|---|---|
| Hollada Brandon D | $115,000 | None Available | |
| Jakubowski Thomas J | $64,000 | -- | |
| -- | $56,900 | -- | |
| -- | -- | -- | |
| -- | -- | -- | |
| -- | -- | -- |
Source: Public Records
Mortgage History
| Date | Status | Borrower | Loan Amount |
|---|---|---|---|
| Open | Hollada Brandon D | $117,000 | |
| Previous Owner | Jakubowski Thomas J | $50,000 |
Source: Public Records
Tax History Compared to Growth
Tax History
| Year | Tax Paid | Tax Assessment Tax Assessment Total Assessment is a certain percentage of the fair market value that is determined by local assessors to be the total taxable value of land and additions on the property. | Land | Improvement |
|---|---|---|---|---|
| 2024 | $1,198 | $192,960 | $14,600 | $178,360 |
| 2023 | $1,198 | $192,960 | $14,600 | $178,360 |
| 2022 | $781 | $114,840 | $13,000 | $101,840 |
| 2021 | $777 | $114,840 | $13,000 | $101,840 |
| 2020 | $777 | $114,840 | $13,000 | $101,840 |
| 2019 | $765 | $114,840 | $13,000 | $101,840 |
| 2018 | $530 | $80,060 | $14,000 | $66,060 |
| 2017 | $530 | $80,060 | $14,000 | $66,060 |
| 2016 | $530 | $80,060 | $14,000 | $66,060 |
| 2015 | $530 | $80,060 | $14,000 | $66,060 |
| 2014 | $511 | $82,790 | $12,500 | $70,290 |
Source: Public Records
Map
Nearby Homes
- 124 Smokestack Ln
- 177 Titanium Dr
- 178 Zircon Dr
- 101 Titanium Dr
- 3925 Taylorsville Hwy
- 138 Zircon Dr
- 759 Lippard Farm Rd
- 126 Penguin Ln
- 110 Little Valley Ln
- 0 Cedarbrook Dr Unit 45
- 114 Cedar Ridge Loop
- 137 Proust Rd
- 198 Castle Pines Ln
- 108 Red Cedar Ln
- 114 Red Cedar Ln
- 4320 Taylorsville Hwy
- 368 Lippard Farm Rd
- 112 Robinette Ln
- 168 Odell Rd
- 117 Grainger Ln
- 260 St Jill Cir
- 274 Saint Jill Cir
- 254 Saint Jill Cir
- Lot 2 St Jill Cir Unit Lot 2
- 0 St Jill Cir Unit 827618
- L2 St Jill Cir
- Lot 0 St Jill Cir
- Lot 0 St Jill Cir Unit Lot 0
- 250 Saint Jill Cir
- 120 Saint Jill Cir
- Lot 1 St Jill Cir
- 106 Saint Jill Cir
- 259 Saint Jill Cir
- 124 Saint Jill Cir
- L3 St Jill Cir
- 253 Saint Jill Cir
- 180 Tarlton Rd
- 130 Saint Jill Cir
- 244 Saint Jill Cir
- 117 Tarlton Rd