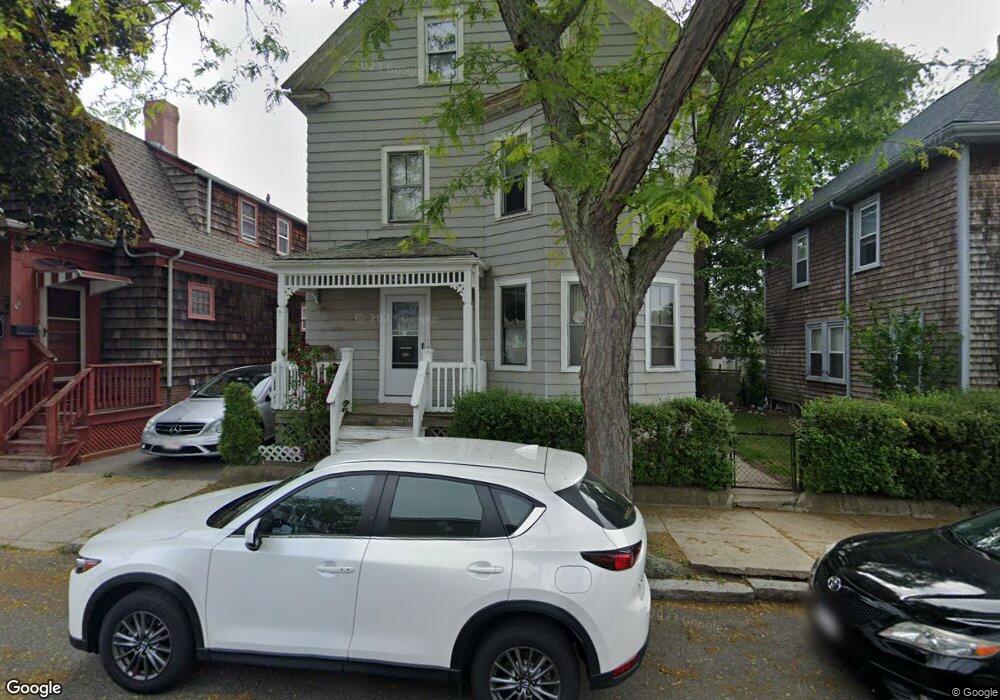
260 Summer St New Bedford, MA 02740
Clasky Park NeighborhoodEstimated Value: $428,000 - $509,000
4
Beds
2
Baths
2,036
Sq Ft
$225/Sq Ft
Est. Value
About This Home
This home is located at 260 Summer St, New Bedford, MA 02740 and is currently estimated at $457,917, approximately $224 per square foot. 260 Summer St is a home located in Bristol County with nearby schools including John Avery Parker, Keith Middle School, and New Bedford High School.
Ownership History
Date
Name
Owned For
Owner Type
Purchase Details
Closed on
Mar 10, 2006
Sold by
Helmersen Bethany and Helmersen David O
Bought by
Desmarais Ruth
Current Estimated Value
Home Financials for this Owner
Home Financials are based on the most recent Mortgage that was taken out on this home.
Original Mortgage
$184,000
Outstanding Balance
$103,866
Interest Rate
6.15%
Mortgage Type
Purchase Money Mortgage
Estimated Equity
$354,051
Purchase Details
Closed on
Jun 6, 2001
Sold by
Demello Joseph C and Demello Rosalie
Bought by
Helmersen David O
Home Financials for this Owner
Home Financials are based on the most recent Mortgage that was taken out on this home.
Original Mortgage
$68,625
Interest Rate
7.08%
Mortgage Type
Purchase Money Mortgage
Create a Home Valuation Report for This Property
The Home Valuation Report is an in-depth analysis detailing your home's value as well as a comparison with similar homes in the area
Home Values in the Area
Average Home Value in this Area
Purchase History
| Date | Buyer | Sale Price | Title Company |
|---|---|---|---|
| Desmarais Ruth | $230,000 | -- | |
| Desmarais Ruth | $230,000 | -- | |
| Helmersen David O | $91,500 | -- | |
| Helmersen David O | $91,500 | -- |
Source: Public Records
Mortgage History
| Date | Status | Borrower | Loan Amount |
|---|---|---|---|
| Open | Helmersen David O | $184,000 | |
| Closed | Helmersen David O | $184,000 | |
| Previous Owner | Helmersen David O | $105,000 | |
| Previous Owner | Helmersen David O | $68,625 |
Source: Public Records
Tax History Compared to Growth
Tax History
| Year | Tax Paid | Tax Assessment Tax Assessment Total Assessment is a certain percentage of the fair market value that is determined by local assessors to be the total taxable value of land and additions on the property. | Land | Improvement |
|---|---|---|---|---|
| 2025 | $3,584 | $316,900 | $87,600 | $229,300 |
| 2024 | $3,283 | $273,600 | $81,400 | $192,200 |
| 2023 | $2,814 | $196,900 | $68,800 | $128,100 |
| 2022 | $2,510 | $161,500 | $62,600 | $98,900 |
| 2021 | $2,469 | $158,400 | $59,500 | $98,900 |
| 2020 | $2,534 | $156,800 | $59,500 | $97,300 |
| 2019 | $2,484 | $150,800 | $59,500 | $91,300 |
| 2018 | $2,445 | $147,000 | $59,500 | $87,500 |
| 2017 | $2,255 | $135,100 | $57,900 | $77,200 |
| 2016 | $2,147 | $130,200 | $56,300 | $73,900 |
| 2015 | $2,007 | $127,600 | $56,300 | $71,300 |
| 2014 | $1,918 | $126,500 | $54,800 | $71,700 |
Source: Public Records
Map
Nearby Homes