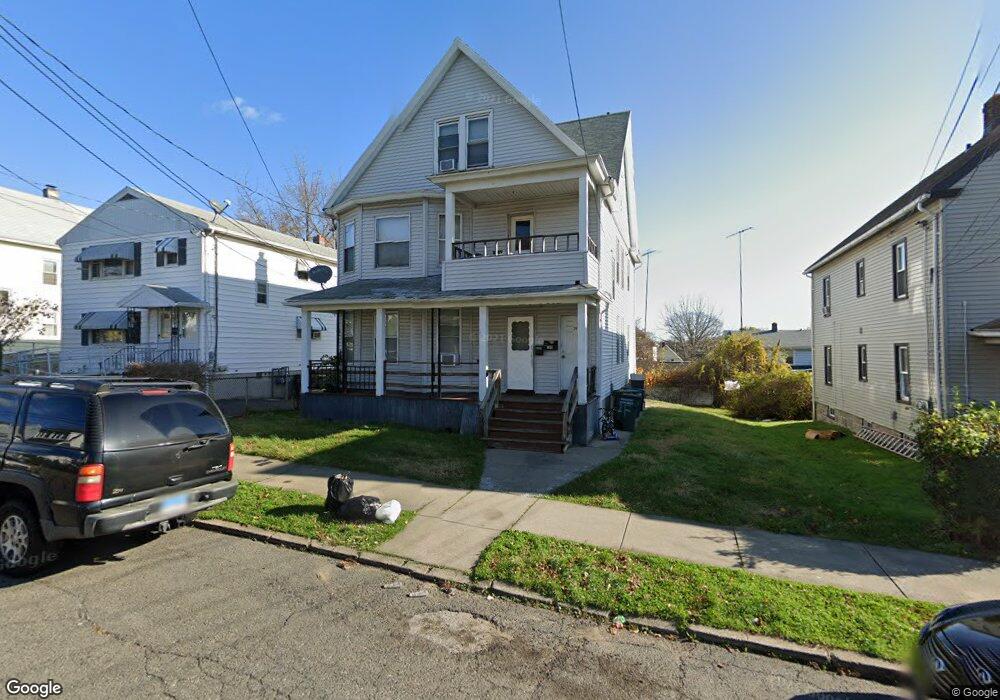
260 Summerfield Ave Bridgeport, CT 06610
Boston Ave-Mill Hill NeighborhoodEstimated Value: $308,540 - $541,000
4
Beds
2
Baths
2,018
Sq Ft
$214/Sq Ft
Est. Value
About This Home
This home is located at 260 Summerfield Ave, Bridgeport, CT 06610 and is currently estimated at $430,885, approximately $213 per square foot. 260 Summerfield Ave is a home located in Fairfield County with nearby schools including Hall School, Harding High School, and Achievement First Bridgeport Academy Elementary School.
Ownership History
Date
Name
Owned For
Owner Type
Purchase Details
Closed on
Feb 16, 2017
Sold by
Tungs Realty Llc
Bought by
Great Anna Realty Llc
Current Estimated Value
Purchase Details
Closed on
Mar 30, 2015
Sold by
Pans Realty Of Shelton
Bought by
Tungs Realty Llc
Purchase Details
Closed on
Feb 1, 2010
Sold by
Kimber Rlty
Bought by
Pans Realty Of Shelton
Purchase Details
Closed on
Sep 9, 2009
Sold by
Jarosko Augustine J
Bought by
Trentini Albert
Create a Home Valuation Report for This Property
The Home Valuation Report is an in-depth analysis detailing your home's value as well as a comparison with similar homes in the area
Home Values in the Area
Average Home Value in this Area
Purchase History
| Date | Buyer | Sale Price | Title Company |
|---|---|---|---|
| Great Anna Realty Llc | -- | -- | |
| Great Anna Realty Llc | -- | -- | |
| Tungs Realty Llc | -- | -- | |
| Tungs Realty Llc | -- | -- | |
| Pans Realty Of Shelton | -- | -- | |
| Pans Realty Of Shelton | -- | -- | |
| Trentini Albert | $4,375 | -- | |
| Trentini Albert | $8,750 | -- | |
| Trentini Albert | -- | -- | |
| Trentini Albert | $4,375 | -- | |
| Trentini Albert | $8,750 | -- | |
| Trentini Albert | $43,750 | -- | |
| Trentini Albert | $8,750 | -- |
Source: Public Records
Mortgage History
| Date | Status | Borrower | Loan Amount |
|---|---|---|---|
| Previous Owner | Trentini Albert | $250,000 |
Source: Public Records
Tax History Compared to Growth
Tax History
| Year | Tax Paid | Tax Assessment Tax Assessment Total Assessment is a certain percentage of the fair market value that is determined by local assessors to be the total taxable value of land and additions on the property. | Land | Improvement |
|---|---|---|---|---|
| 2025 | $5,273 | $121,350 | $59,730 | $61,620 |
| 2024 | $5,273 | $121,350 | $59,730 | $61,620 |
| 2023 | $5,273 | $121,350 | $59,730 | $61,620 |
| 2022 | $5,273 | $121,350 | $59,730 | $61,620 |
| 2021 | $5,273 | $121,350 | $59,730 | $61,620 |
| 2020 | $5,263 | $97,490 | $19,670 | $77,820 |
| 2019 | $5,263 | $97,490 | $19,670 | $77,820 |
| 2018 | $5,301 | $97,490 | $19,670 | $77,820 |
| 2017 | $5,301 | $97,490 | $19,670 | $77,820 |
| 2016 | $5,301 | $97,490 | $19,670 | $77,820 |
| 2015 | $6,197 | $146,840 | $34,270 | $112,570 |
| 2014 | $6,197 | $146,840 | $34,270 | $112,570 |
Source: Public Records
Map
Nearby Homes
- 215 Summerfield Ave
- 123-125 Summerfield Ave
- 123 Summerfield Ave
- 73 Pixlee Place
- 400 East Ave
- 270 East Ave
- 1922 Boston Ave Unit 1924
- 1575 Boston Ave Unit B2
- 652 Bishop Ave Unit 656
- 35 Kent Ave
- 1804 Barnum Ave
- 69 Weber Ave
- 102 Bowe Ave
- 3 Granfield Ave
- 357 Granfield Ave Unit B
- 415 Bruce Ave
- 401 Granfield Ave Unit 2
- 361 Granfield Ave Unit Bldg 8, A
- 260 Success Ave Unit 21
- 37 Granfield Ave Unit 39
- 246 Summerfield Ave
- 234 Summerfield Ave
- 223 Prince St
- 243 Prince St
- 270 Summerfield Ave
- 233 Prince St
- 233 Prince St Unit 1
- 235 Prince St Unit 2
- 213 Prince St
- 267 Summerfield Ave
- 253 Prince St
- 257 Summerfield Ave
- 280 Summerfield Ave
- 247 Summerfield Ave
- 277 Summerfield Ave
- 222 Summerfield Ave Unit 224
- 265 Prince St
- 203 Prince St
- 190 Clermont Ave Unit 192
- 214 Summerfield Ave