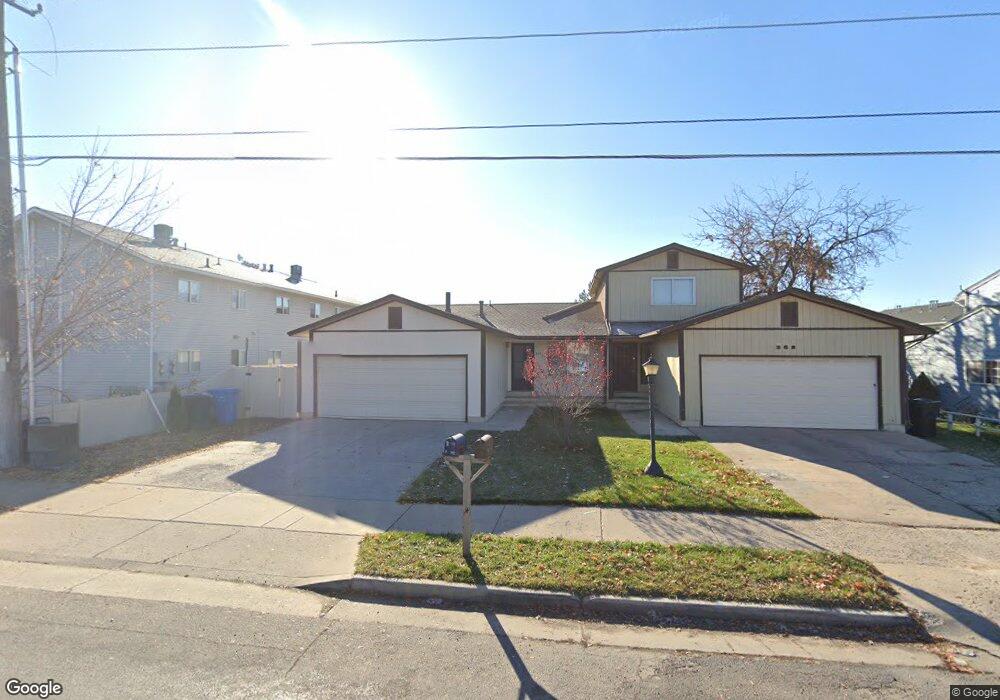
260 W 1000 N Logan, UT 84321
Bridger NeighborhoodEstimated Value: $279,000 - $325,000
2
Beds
1
Bath
966
Sq Ft
$308/Sq Ft
Est. Value
About This Home
This home is located at 260 W 1000 N, Logan, UT 84321 and is currently estimated at $297,592, approximately $308 per square foot. 260 W 1000 N is a home located in Cache County with nearby schools including Bridger School, Mount Logan Middle School, and Logan High School.
Ownership History
Date
Name
Owned For
Owner Type
Purchase Details
Closed on
Aug 29, 2019
Sold by
Jensen Leon B and Jensen Kikue Matsui
Bought by
Young Mykelle M and Young Jentry L
Current Estimated Value
Home Financials for this Owner
Home Financials are based on the most recent Mortgage that was taken out on this home.
Original Mortgage
$105,000
Outstanding Balance
$91,951
Interest Rate
3.8%
Mortgage Type
New Conventional
Estimated Equity
$205,641
Create a Home Valuation Report for This Property
The Home Valuation Report is an in-depth analysis detailing your home's value as well as a comparison with similar homes in the area
Home Values in the Area
Average Home Value in this Area
Purchase History
| Date | Buyer | Sale Price | Title Company |
|---|---|---|---|
| Young Mykelle M | -- | American Secure Title Logan |
Source: Public Records
Mortgage History
| Date | Status | Borrower | Loan Amount |
|---|---|---|---|
| Open | Young Mykelle M | $105,000 |
Source: Public Records
Tax History Compared to Growth
Tax History
| Year | Tax Paid | Tax Assessment Tax Assessment Total Assessment is a certain percentage of the fair market value that is determined by local assessors to be the total taxable value of land and additions on the property. | Land | Improvement |
|---|---|---|---|---|
| 2025 | $1,180 | $277,560 | $112,200 | $165,360 |
| 2024 | $1,219 | $277,560 | $112,200 | $165,360 |
| 2023 | $1,268 | $275,360 | $110,000 | $165,360 |
| 2022 | $1,013 | $205,360 | $40,000 | $165,360 |
| 2021 | $971 | $167,200 | $40,000 | $127,200 |
| 2020 | $942 | $146,000 | $40,000 | $106,000 |
| 2019 | $977 | $144,935 | $40,000 | $104,935 |
| 2018 | $952 | $128,928 | $40,000 | $88,928 |
| 2017 | $856 | $61,270 | $0 | $0 |
| 2016 | $887 | $51,920 | $0 | $0 |
| 2015 | $753 | $51,920 | $0 | $0 |
| 2014 | $646 | $49,320 | $0 | $0 |
| 2013 | -- | $49,320 | $0 | $0 |
Source: Public Records
Map
Nearby Homes