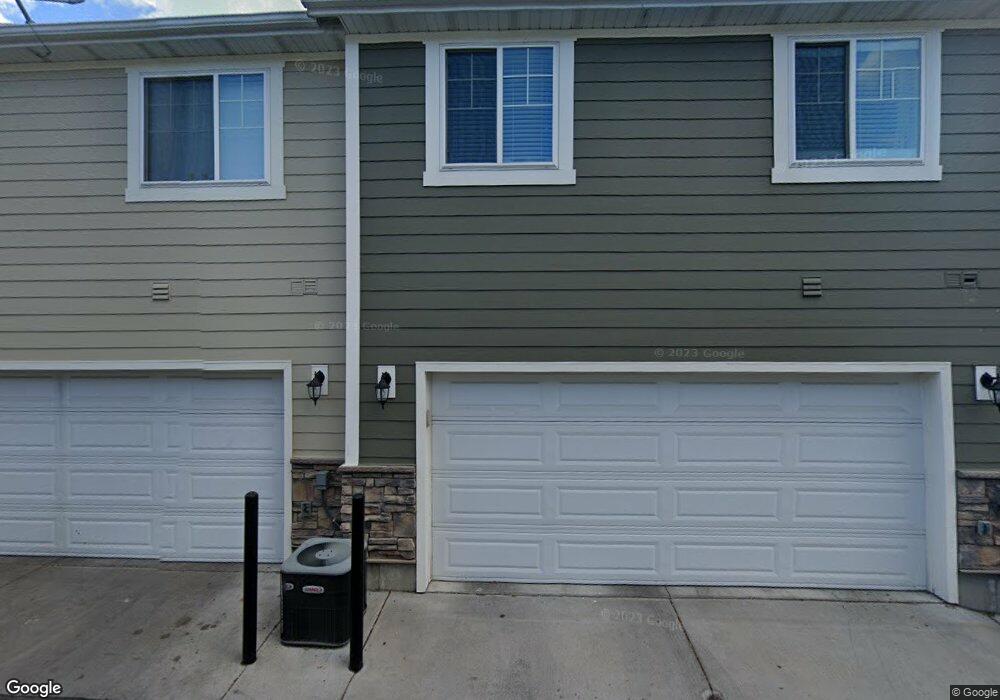
260 W 1010 S Logan, UT 84321
Woodruff NeighborhoodEstimated Value: $279,232 - $328,000
3
Beds
3
Baths
1,302
Sq Ft
$238/Sq Ft
Est. Value
About This Home
This home is located at 260 W 1010 S, Logan, UT 84321 and is currently estimated at $309,308, approximately $237 per square foot. 260 W 1010 S is a home located in Cache County with nearby schools including Hillcrest Elementary School, Mount Logan Middle School, and Logan High School.
Ownership History
Date
Name
Owned For
Owner Type
Purchase Details
Closed on
Jun 17, 2019
Sold by
Austin Jordan
Bought by
Austin Jordan and Austin Samantha H
Current Estimated Value
Home Financials for this Owner
Home Financials are based on the most recent Mortgage that was taken out on this home.
Original Mortgage
$184,300
Outstanding Balance
$161,708
Interest Rate
4.1%
Mortgage Type
New Conventional
Estimated Equity
$147,600
Purchase Details
Closed on
May 27, 2016
Sold by
Galloway Nikole and Tryon Nikole
Bought by
Bankus Andrew Kyle and Bankus Dawna
Purchase Details
Closed on
Nov 9, 2009
Sold by
Drd Property Development Llc
Bought by
Galloway Nikole
Home Financials for this Owner
Home Financials are based on the most recent Mortgage that was taken out on this home.
Original Mortgage
$132,783
Interest Rate
4.92%
Mortgage Type
FHA
Create a Home Valuation Report for This Property
The Home Valuation Report is an in-depth analysis detailing your home's value as well as a comparison with similar homes in the area
Home Values in the Area
Average Home Value in this Area
Purchase History
| Date | Buyer | Sale Price | Title Company |
|---|---|---|---|
| Austin Jordan | -- | Cache Title Logan | |
| Austin Jordan | -- | Cache Title Logan | |
| Bankus Andrew Kyle | -- | Cache Title Logan | |
| Galloway Nikole | -- | Pinnacle Title Ins Agency | |
| Drd Property Development Llc | -- | Pinnacle Title Ins Agency |
Source: Public Records
Mortgage History
| Date | Status | Borrower | Loan Amount |
|---|---|---|---|
| Open | Austin Jordan | $184,300 | |
| Previous Owner | Galloway Nikole | $132,783 |
Source: Public Records
Tax History
| Year | Tax Paid | Tax Assessment Tax Assessment Total Assessment is a certain percentage of the fair market value that is determined by local assessors to be the total taxable value of land and additions on the property. | Land | Improvement |
|---|---|---|---|---|
| 2025 | $119 | $154,410 | $0 | $0 |
| 2024 | $1,353 | $169,475 | $0 | $0 |
| 2023 | $1,503 | $179,465 | $0 | $0 |
| 2022 | $1,671 | $186,340 | $0 | $0 |
| 2021 | $1,098 | $189,062 | $38,000 | $151,062 |
| 2020 | $1,092 | $169,359 | $38,000 | $131,359 |
| 2019 | $1,142 | $169,359 | $38,000 | $131,359 |
| 2018 | $1,147 | $155,285 | $38,000 | $117,285 |
| 2017 | $1,076 | $77,055 | $0 | $0 |
| 2016 | $1,116 | $71,940 | $0 | $0 |
| 2015 | $1,022 | $70,535 | $0 | $0 |
| 2014 | $924 | $70,535 | $0 | $0 |
| 2013 | -- | $70,535 | $0 | $0 |
Source: Public Records
Map
Nearby Homes
Your Personal Tour Guide
Ask me questions while you tour the home.