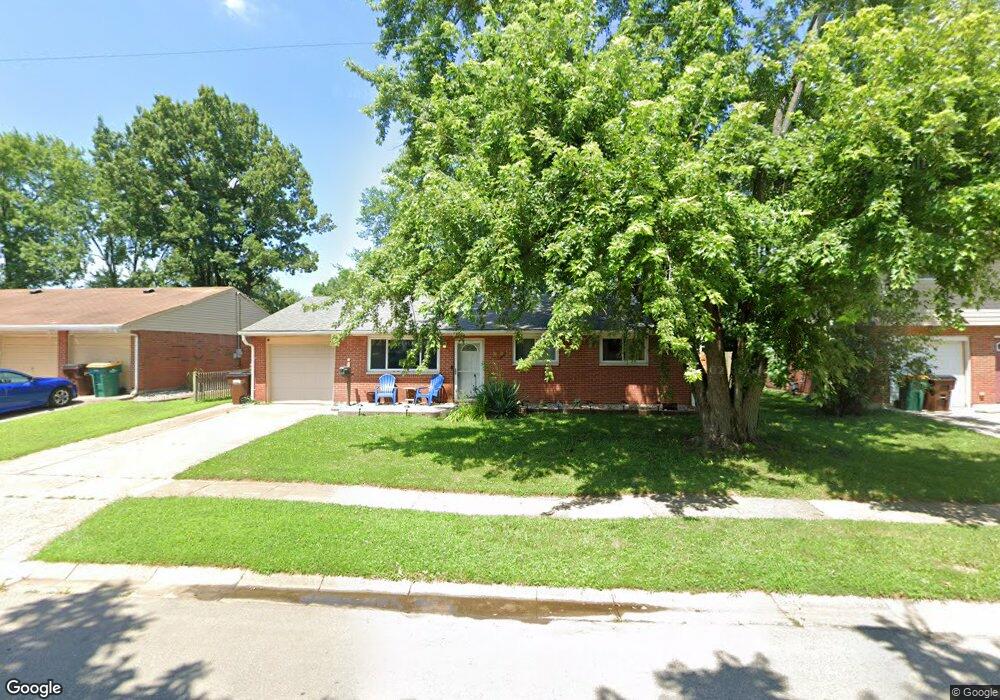
260 W Factory Rd Springboro, OH 45066
Estimated Value: $259,000 - $267,867
3
Beds
2
Baths
1,696
Sq Ft
$155/Sq Ft
Est. Value
About This Home
This home is located at 260 W Factory Rd, Springboro, OH 45066 and is currently estimated at $262,217, approximately $154 per square foot. 260 W Factory Rd is a home located in Warren County with nearby schools including Clearcreek Elementary School, Springboro Intermediate School, and Dennis Elementary School.
Ownership History
Date
Name
Owned For
Owner Type
Purchase Details
Closed on
Jun 5, 2023
Sold by
Lucas Patrick J
Bought by
Thomas Tina D
Current Estimated Value
Purchase Details
Closed on
May 12, 2004
Sold by
Rivers John K
Bought by
Thomas Tina D
Home Financials for this Owner
Home Financials are based on the most recent Mortgage that was taken out on this home.
Original Mortgage
$21,600
Interest Rate
6.5%
Mortgage Type
Credit Line Revolving
Purchase Details
Closed on
Sep 18, 2002
Sold by
Stuckey David
Bought by
Rivers John K
Home Financials for this Owner
Home Financials are based on the most recent Mortgage that was taken out on this home.
Original Mortgage
$98,800
Interest Rate
6.4%
Mortgage Type
New Conventional
Purchase Details
Closed on
Jul 17, 1987
Sold by
Mantia Steve and Mantia Diana
Bought by
Stuckey and Stuckey David B
Purchase Details
Closed on
Sep 27, 1979
Sold by
Wade Wade and Wade Elizabeth A
Create a Home Valuation Report for This Property
The Home Valuation Report is an in-depth analysis detailing your home's value as well as a comparison with similar homes in the area
Home Values in the Area
Average Home Value in this Area
Purchase History
| Date | Buyer | Sale Price | Title Company |
|---|---|---|---|
| Thomas Tina D | $11,333 | None Listed On Document | |
| Thomas Tina D | $108,000 | Home Services Title Llc | |
| Rivers John K | $104,000 | -- | |
| Stuckey | $39,400 | -- | |
| -- | $46,000 | -- |
Source: Public Records
Mortgage History
| Date | Status | Borrower | Loan Amount |
|---|---|---|---|
| Previous Owner | Thomas Tina D | $21,600 | |
| Previous Owner | Thomas Tina D | $86,400 | |
| Previous Owner | Rivers John K | $98,800 |
Source: Public Records
Tax History Compared to Growth
Tax History
| Year | Tax Paid | Tax Assessment Tax Assessment Total Assessment is a certain percentage of the fair market value that is determined by local assessors to be the total taxable value of land and additions on the property. | Land | Improvement |
|---|---|---|---|---|
| 2024 | $2,615 | $66,970 | $17,500 | $49,470 |
| 2023 | $2,296 | $54,722 | $10,762 | $43,960 |
| 2022 | $2,296 | $54,723 | $10,763 | $43,960 |
| 2021 | $2,137 | $54,723 | $10,763 | $43,960 |
| 2020 | $1,987 | $44,489 | $8,750 | $35,739 |
| 2019 | $1,832 | $44,489 | $8,750 | $35,739 |
| 2018 | $1,847 | $44,489 | $8,750 | $35,739 |
| 2017 | $1,880 | $39,981 | $8,134 | $31,847 |
| 2016 | $1,908 | $39,981 | $8,134 | $31,847 |
| 2015 | $1,912 | $39,981 | $8,134 | $31,847 |
| 2014 | $1,959 | $38,820 | $7,900 | $30,920 |
| 2013 | $1,958 | $43,010 | $8,750 | $34,260 |
Source: Public Records
Map
Nearby Homes
- 145 Woods Rd
- 145 Redbud Dr
- 125 W Market St
- 40 Libby Hollow St
- 10 Annie Grove Ln
- The McPherson Plan at Wadestone - Designer Collection
- Winslow Plan at Wadestone - Masterpiece Collection
- Avery Plan at Wadestone - Designer Collection
- Emmett Plan at Wadestone - Designer Collection
- Rhodes Plan at Wadestone - Masterpiece Collection
- Carrington Plan at Wadestone - Designer Collection
- Winston Plan at Wadestone - Designer Collection
- Paxton Plan at Wadestone - Masterpiece Collection
- Calvin Plan at Wadestone - Designer Collection
- Magnolia Plan at Wadestone - Designer Collection
- Pearson Plan at Wadestone - Masterpiece Collection
- Blair Plan at Wadestone - Designer Collection
- Grandin Plan at Wadestone - Designer Collection
- Finley Plan at Wadestone - Masterpiece Collection
- Mitchell Plan at Wadestone - Masterpiece Collection
- 250 W Factory Rd
- 270 W Factory Rd
- 35 Kesling Dr
- 45 Kesling Dr
- 280 W Factory Rd
- 25 Kesling Dr
- 55 Kesling Dr
- 12 Myers Farm Ct
- 8 Myers Farm Ct
- 15 Kesling Dr
- 290 W Factory Rd
- 16 Myers Farm Ct
- 65 Kesling Dr
- 4 Myers Farm Ct
- 20 Myers Farm Ct
- 300 W Factory Rd
- 336 Woodside Trail
- 24 Myers Farm Ct
- 75 Kesling Dr
- 105 Willow Dr