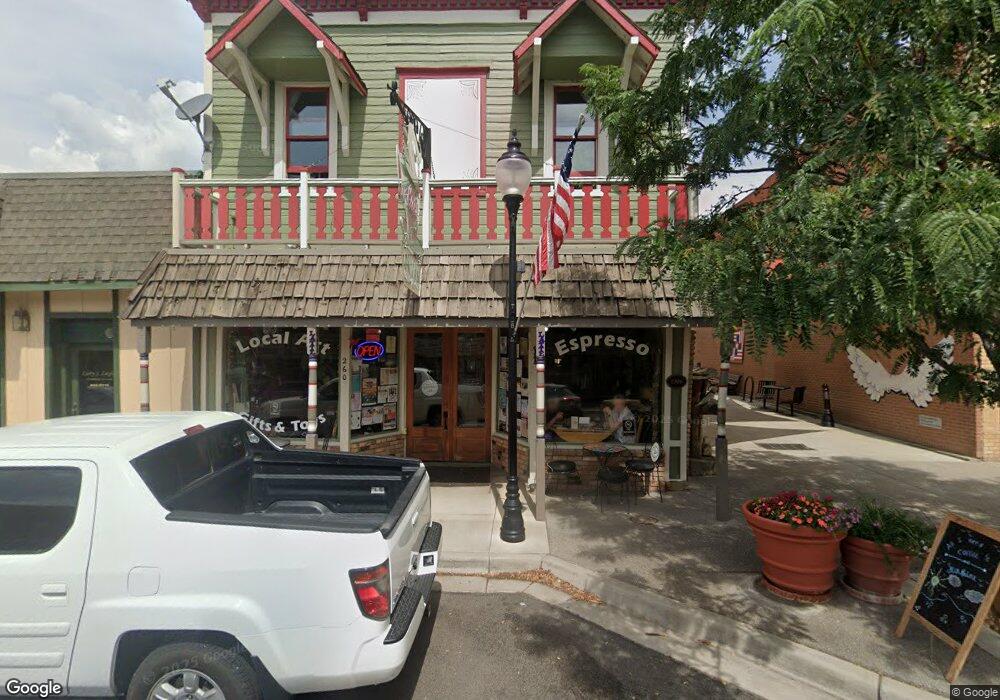
260 W Main St Cedaredge, CO 81413
Estimated Value: $340,610 - $469,000
2
Beds
2
Baths
2,675
Sq Ft
$153/Sq Ft
Est. Value
About This Home
This home is located at 260 W Main St, Cedaredge, CO 81413 and is currently estimated at $409,203, approximately $152 per square foot. 260 W Main St is a home located in Delta County with nearby schools including Cedaredge Elementary School, Cedaredge Middle School, and Cedaredge High School.
Ownership History
Date
Name
Owned For
Owner Type
Purchase Details
Closed on
Jul 1, 2022
Sold by
Main Street Market Inc
Bought by
Starr Properties Llc
Current Estimated Value
Home Financials for this Owner
Home Financials are based on the most recent Mortgage that was taken out on this home.
Original Mortgage
$225,000
Outstanding Balance
$203,068
Interest Rate
5.25%
Mortgage Type
New Conventional
Estimated Equity
$206,135
Purchase Details
Closed on
Jan 5, 2021
Sold by
Malmgren Stacy and Malmgren Scott
Bought by
Main Street Market Inc
Home Financials for this Owner
Home Financials are based on the most recent Mortgage that was taken out on this home.
Original Mortgage
$237,242
Interest Rate
2.7%
Mortgage Type
Commercial
Purchase Details
Closed on
May 31, 2016
Sold by
Munson Tracy Y
Bought by
Malmgren Stacy and Malmgren Scott
Purchase Details
Closed on
Oct 1, 1999
Sold by
Travis
Bought by
Malmgren Stacy and Malmgren Munson
Create a Home Valuation Report for This Property
The Home Valuation Report is an in-depth analysis detailing your home's value as well as a comparison with similar homes in the area
Purchase History
| Date | Buyer | Sale Price | Title Company |
|---|---|---|---|
| Starr Properties Llc | $325,000 | Land Title Guarantee | |
| Main Street Market Inc | $315,000 | Land Title Guarantee Co | |
| Malmgren Stacy | $223,000 | Heritage Title | |
| Malmgren Stacy | $114,000 | -- |
Source: Public Records
Mortgage History
| Date | Status | Borrower | Loan Amount |
|---|---|---|---|
| Open | Starr Properties Llc | $225,000 | |
| Previous Owner | Main Street Market Inc | $237,242 |
Source: Public Records
Tax History
| Year | Tax Paid | Tax Assessment Tax Assessment Total Assessment is a certain percentage of the fair market value that is determined by local assessors to be the total taxable value of land and additions on the property. | Land | Improvement |
|---|---|---|---|---|
| 2024 | $2,198 | $32,250 | $4,347 | $27,903 |
| 2023 | $2,198 | $32,250 | $4,347 | $27,903 |
| 2022 | $2,996 | $44,719 | $4,400 | $40,319 |
| 2021 | $1,941 | $29,925 | $4,439 | $25,486 |
| 2020 | $1,961 | $29,334 | $5,027 | $24,307 |
| 2019 | $1,958 | $29,334 | $5,027 | $24,307 |
| 2018 | $1,895 | $27,069 | $4,966 | $22,103 |
| 2017 | $1,894 | $27,069 | $4,966 | $22,103 |
| 2016 | $1,824 | $28,317 | $5,043 | $23,274 |
| 2014 | -- | $29,708 | $5,876 | $23,832 |
Source: Public Records
Map
Nearby Homes
- 190 & 170 SW 2nd Ave Unit A, B, C
- 245 NW 3rd St
- 550 W Main St
- 590 NW Aspen
- 160 SE Antelope Ave
- 370 S Grand Mesa Dr
- 105 SE Buffalo Ave
- 135 SE Buffalo Ave
- 180 NW 7th St
- 470 NW Cedar Ave
- 285 NW 7th St
- 110 SE Eagle Ave
- 633 E Main St
- 165 SE Eagle Ave
- 320 SW 8th St
- 915 NW Birch Ave
- 520 SE Stonebridge Dr
- 640 3/4 S Grand Mesa Dr
- 185 & 165 NW 11th St
- 180 1/2 SW 8th Ave
- 0 E Main St Unit 711783
- 280 W Main St
- 230 & 240 W Main St
- 290 W Main St
- NW 3rd St
- 205 W Main St
- 220 W Main St
- 130&140 W Main St
- 110 NW 2nd St
- 215 W Main St
- 165 NW 3rd St
- 195 W Main St
- 295 W Main St
- 155 NW 2nd St
- 180 W Main St
- 130 SW 2nd St
- 190 NW 2nd St
- 265 NW Aspen
- 170 W Main St
- 140 & 140 1 2 Sw 2nd St
Your Personal Tour Guide
Ask me questions while you tour the home.