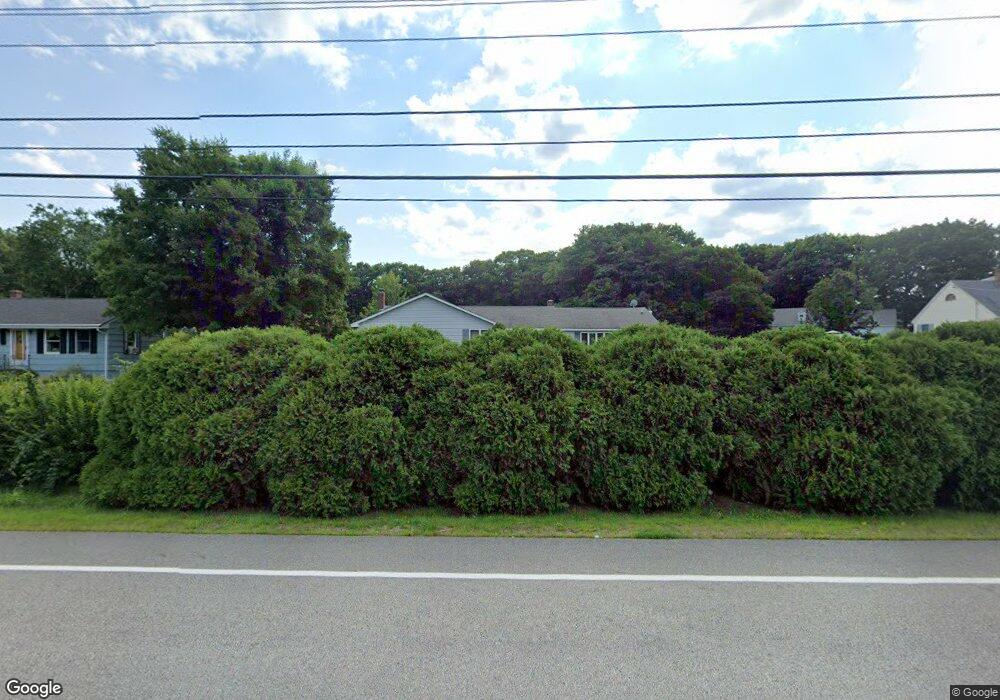
260 West St Biddeford, ME 04005
South Biddeford NeighborhoodEstimated Value: $555,000 - $601,000
3
Beds
2
Baths
2,296
Sq Ft
$249/Sq Ft
Est. Value
About This Home
This home is located at 260 West St, Biddeford, ME 04005 and is currently estimated at $572,245, approximately $249 per square foot. 260 West St is a home located in York County with nearby schools including John F Kennedy Memorial School, Biddeford Primary School, and Biddeford Intermediate School.
Ownership History
Date
Name
Owned For
Owner Type
Purchase Details
Closed on
Aug 23, 2011
Sold by
Roy Joyce J and Gagnon Joyce J
Bought by
Saintamand Cynthia M and Saintamand Richard S
Current Estimated Value
Home Financials for this Owner
Home Financials are based on the most recent Mortgage that was taken out on this home.
Original Mortgage
$223,250
Outstanding Balance
$154,935
Interest Rate
4.62%
Mortgage Type
Purchase Money Mortgage
Estimated Equity
$417,310
Purchase Details
Closed on
Dec 5, 2007
Sold by
Hartsell Diane I and Hartsell Danny R
Bought by
Roy Joyce J
Home Financials for this Owner
Home Financials are based on the most recent Mortgage that was taken out on this home.
Original Mortgage
$199,500
Interest Rate
6.37%
Mortgage Type
Purchase Money Mortgage
Create a Home Valuation Report for This Property
The Home Valuation Report is an in-depth analysis detailing your home's value as well as a comparison with similar homes in the area
Home Values in the Area
Average Home Value in this Area
Purchase History
| Date | Buyer | Sale Price | Title Company |
|---|---|---|---|
| Saintamand Cynthia M | -- | -- | |
| Roy Joyce J | -- | -- |
Source: Public Records
Mortgage History
| Date | Status | Borrower | Loan Amount |
|---|---|---|---|
| Open | Saintamand Cynthia M | $223,250 | |
| Previous Owner | Roy Joyce J | $199,500 |
Source: Public Records
Tax History Compared to Growth
Tax History
| Year | Tax Paid | Tax Assessment Tax Assessment Total Assessment is a certain percentage of the fair market value that is determined by local assessors to be the total taxable value of land and additions on the property. | Land | Improvement |
|---|---|---|---|---|
| 2024 | $6,493 | $456,600 | $169,500 | $287,100 |
| 2023 | $5,951 | $453,600 | $166,500 | $287,100 |
| 2022 | $5,478 | $333,800 | $93,700 | $240,100 |
| 2021 | $5,237 | $287,300 | $79,200 | $208,100 |
| 2020 | $5,313 | $265,000 | $72,000 | $193,000 |
| 2019 | $5,295 | $265,000 | $72,000 | $193,000 |
| 2018 | $5,221 | $265,000 | $72,000 | $193,000 |
| 2017 | $4,863 | $242,300 | $72,000 | $170,300 |
| 2016 | $4,812 | $242,300 | $72,000 | $170,300 |
| 2015 | $4,718 | $242,300 | $72,000 | $170,300 |
| 2014 | $4,601 | $242,300 | $72,000 | $170,300 |
| 2013 | -- | $243,800 | $63,900 | $179,900 |
Source: Public Records
Map
Nearby Homes