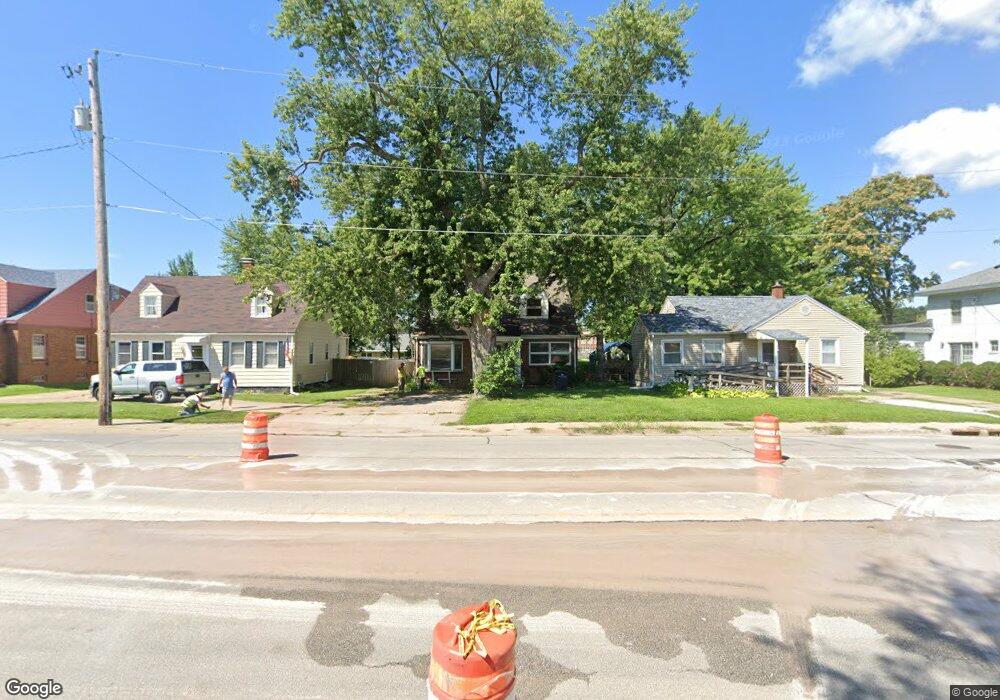
2600 11th St Unit 2 Rock Island, IL 61201
West Central Rock Island NeighborhoodEstimated Value: $118,000 - $152,000
5
Beds
2
Baths
1,992
Sq Ft
$67/Sq Ft
Est. Value
About This Home
This home is located at 2600 11th St Unit 2, Rock Island, IL 61201 and is currently estimated at $133,662, approximately $67 per square foot. 2600 11th St Unit 2 is a home located in Rock Island County with nearby schools including Frances Willard Elementary School, Edison Jr High School, and Rock Island High School.
Ownership History
Date
Name
Owned For
Owner Type
Purchase Details
Closed on
Mar 6, 2025
Sold by
Itabelo Ibonge B
Bought by
Homeless To Ownership Llc
Current Estimated Value
Home Financials for this Owner
Home Financials are based on the most recent Mortgage that was taken out on this home.
Original Mortgage
$114,000
Outstanding Balance
$104,294
Interest Rate
6.95%
Mortgage Type
New Conventional
Estimated Equity
$29,368
Purchase Details
Closed on
Feb 19, 2021
Sold by
Begyn Kristina L
Bought by
Itabelo Ibonge B
Home Financials for this Owner
Home Financials are based on the most recent Mortgage that was taken out on this home.
Original Mortgage
$48,750
Interest Rate
2.7%
Mortgage Type
New Conventional
Purchase Details
Closed on
Nov 1, 2009
Create a Home Valuation Report for This Property
The Home Valuation Report is an in-depth analysis detailing your home's value as well as a comparison with similar homes in the area
Home Values in the Area
Average Home Value in this Area
Purchase History
| Date | Buyer | Sale Price | Title Company |
|---|---|---|---|
| Homeless To Ownership Llc | $140,000 | None Listed On Document | |
| Itabelo Ibonge B | $65,000 | Gomez Title | |
| -- | $62,100 | -- |
Source: Public Records
Mortgage History
| Date | Status | Borrower | Loan Amount |
|---|---|---|---|
| Open | Homeless To Ownership Llc | $114,000 | |
| Previous Owner | Itabelo Ibonge B | $48,750 |
Source: Public Records
Tax History Compared to Growth
Tax History
| Year | Tax Paid | Tax Assessment Tax Assessment Total Assessment is a certain percentage of the fair market value that is determined by local assessors to be the total taxable value of land and additions on the property. | Land | Improvement |
|---|---|---|---|---|
| 2024 | $3,092 | $30,725 | $5,053 | $25,672 |
| 2023 | $3,092 | $28,111 | $4,623 | $23,488 |
| 2022 | $2,697 | $26,371 | $4,337 | $22,034 |
| 2021 | $2,643 | $25,044 | $4,119 | $20,925 |
| 2020 | $2,588 | $24,362 | $4,007 | $20,355 |
| 2019 | $2,560 | $24,120 | $3,967 | $20,153 |
| 2018 | $2,445 | $23,486 | $3,863 | $19,623 |
| 2017 | $2,377 | $22,706 | $3,735 | $18,971 |
| 2016 | $2,306 | $22,706 | $3,735 | $18,971 |
| 2015 | $2,304 | $22,706 | $3,735 | $18,971 |
| 2014 | -- | $21,997 | $3,618 | $18,379 |
| 2013 | -- | $21,997 | $3,618 | $18,379 |
Source: Public Records
Map
Nearby Homes