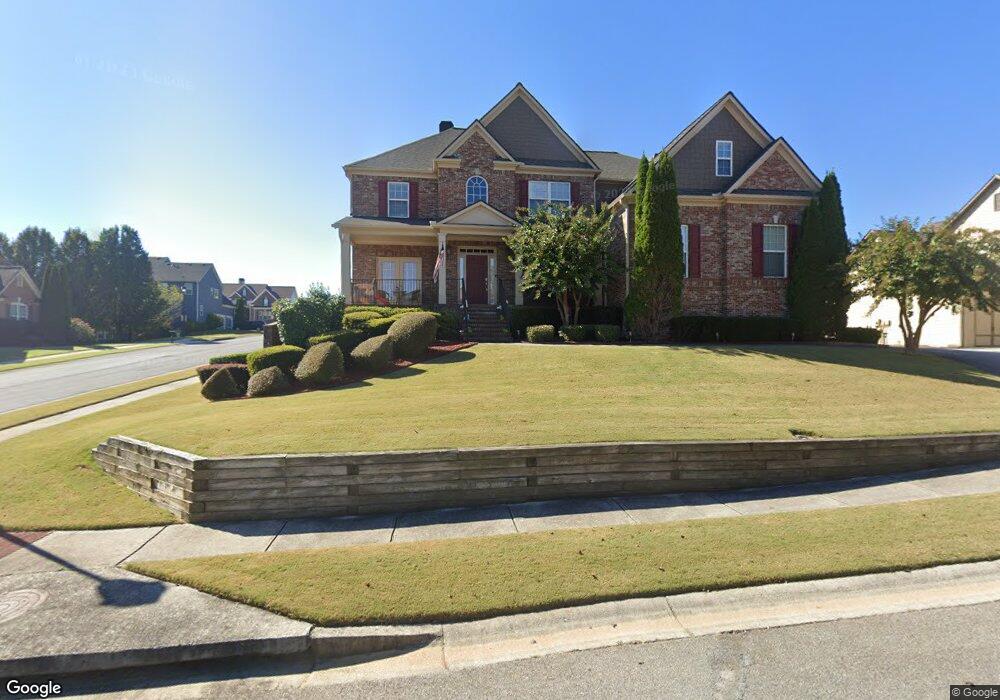
2600 Abiqua Falls Ct Unit 1 Braselton, GA 30517
Estimated Value: $541,000 - $639,000
5
Beds
4
Baths
3,873
Sq Ft
$151/Sq Ft
Est. Value
About This Home
This home is located at 2600 Abiqua Falls Ct Unit 1, Braselton, GA 30517 and is currently estimated at $586,524, approximately $151 per square foot. 2600 Abiqua Falls Ct Unit 1 is a home located in Barrow County with nearby schools including Bramlett Elementary School, Russell Middle School, and Winder-Barrow High School.
Ownership History
Date
Name
Owned For
Owner Type
Purchase Details
Closed on
May 14, 2007
Sold by
Ascenture Hms Llc
Bought by
Vegas Samuel J and Vegas Vicky R
Current Estimated Value
Home Financials for this Owner
Home Financials are based on the most recent Mortgage that was taken out on this home.
Original Mortgage
$200,000
Outstanding Balance
$84,959
Interest Rate
6.17%
Mortgage Type
New Conventional
Estimated Equity
$501,565
Purchase Details
Closed on
Mar 22, 2006
Sold by
Falls Llc
Bought by
Ccd Hms Llc
Home Financials for this Owner
Home Financials are based on the most recent Mortgage that was taken out on this home.
Original Mortgage
$1,052,000
Interest Rate
6.2%
Purchase Details
Closed on
Apr 15, 2005
Sold by
Dagpau Inc
Bought by
The Falls Llc
Purchase Details
Closed on
Nov 12, 2002
Bought by
Dagpau Inc
Create a Home Valuation Report for This Property
The Home Valuation Report is an in-depth analysis detailing your home's value as well as a comparison with similar homes in the area
Home Values in the Area
Average Home Value in this Area
Purchase History
| Date | Buyer | Sale Price | Title Company |
|---|---|---|---|
| Vegas Samuel J | $360,000 | -- | |
| Ccd Hms Llc | $236,000 | -- | |
| Ccd Homes Llc | $59,000 | -- | |
| The Falls Llc | -- | -- | |
| Dagpau Inc | -- | -- |
Source: Public Records
Mortgage History
| Date | Status | Borrower | Loan Amount |
|---|---|---|---|
| Open | Vegas Samuel J | $200,000 | |
| Previous Owner | Ccd Homes Llc | $1,052,000 |
Source: Public Records
Tax History Compared to Growth
Tax History
| Year | Tax Paid | Tax Assessment Tax Assessment Total Assessment is a certain percentage of the fair market value that is determined by local assessors to be the total taxable value of land and additions on the property. | Land | Improvement |
|---|---|---|---|---|
| 2024 | $5,630 | $222,016 | $36,000 | $186,016 |
| 2023 | $5,172 | $222,016 | $36,000 | $186,016 |
| 2022 | $5,175 | $178,622 | $29,200 | $149,422 |
| 2021 | $4,829 | $156,250 | $24,000 | $132,250 |
| 2020 | $4,545 | $146,526 | $20,000 | $126,526 |
| 2019 | $4,439 | $141,146 | $20,000 | $121,146 |
| 2018 | $4,164 | $133,110 | $20,000 | $113,110 |
| 2017 | $3,542 | $121,646 | $20,000 | $101,646 |
| 2016 | $3,565 | $115,029 | $20,000 | $95,029 |
| 2015 | $3,603 | $116,055 | $20,000 | $96,055 |
| 2014 | $2,933 | $98,802 | $11,368 | $87,434 |
| 2013 | -- | $91,780 | $11,368 | $80,412 |
Source: Public Records
Map
Nearby Homes
- 1919 Henderson Falls Way
- 747 Sienna Valley Dr
- 1208 Loowit Falls Ct
- 793 Sienna Valley Dr
- 1602 Sahale Falls Dr
- 908 Rainsong Ct
- 914 Rainsong Ct
- 1497 Kilchis Falls Way
- 105 Chablis Ct
- 2109 Yvette Way
- 2046 Yvette Way
- 6356 Mossy Oak Landing
- 2017 Yvette Way
- 2162 Georgia Highway 211
- 1718 Landon Ln
- 7062 Grand Hickory Dr
- 2655 Old Winder Hwy
- 1721 Landon Ln
- 2602 Abiqua Falls Ct
- 918 Wallace Falls Dr
- 915 Wallace Falls Dr
- 913 Wallace Falls Dr
- 910 Wallace Falls Dr Unit 1
- 2606 Abiqua Falls Ct
- 917 Wallace Falls Dr
- 2511 Olney Falls Dr
- 2603 Abiqua Falls Ct
- 920 Wallace Falls Dr
- 0 Wallace Falls Dr Unit 7014532
- 0 Wallace Falls Dr Unit 7326444
- 0 Wallace Falls Dr Unit 7056051
- 0 Wallace Falls Dr Unit 8872727
- 0 Wallace Falls Dr Unit 8832919
- 0 Wallace Falls Dr Unit 8616770
- 0 Wallace Falls Dr Unit 8592418
- 0 Wallace Falls Dr Unit 8544112
- 0 Wallace Falls Dr Unit 8423056
- 0 Wallace Falls Dr Unit 8235840