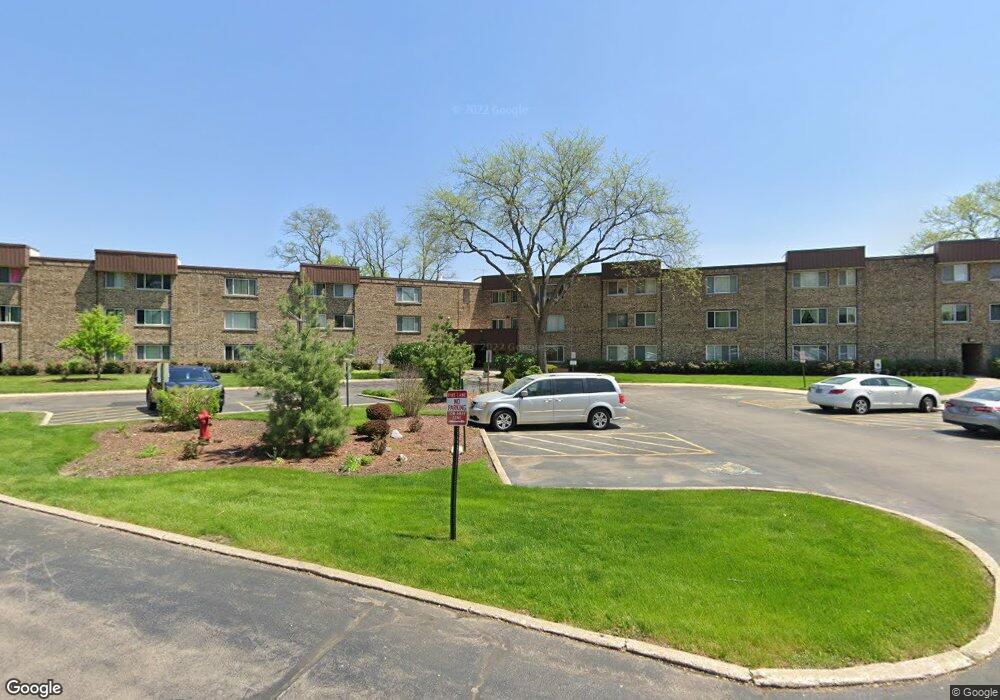
2600 Brookwood Way Dr Unit 213 Rolling Meadows, IL 60008
Creekside NeighborhoodEstimated Value: $166,000 - $203,000
2
Beds
2
Baths
850
Sq Ft
$221/Sq Ft
Est. Value
About This Home
This home is located at 2600 Brookwood Way Dr Unit 213, Rolling Meadows, IL 60008 and is currently estimated at $187,806, approximately $220 per square foot. 2600 Brookwood Way Dr Unit 213 is a home located in Cook County with nearby schools including Central Road Elementary School, William Fremd High School, and St Colette School.
Ownership History
Date
Name
Owned For
Owner Type
Purchase Details
Closed on
Feb 7, 2011
Sold by
Federal Home Loan Mortgage Corporation
Bought by
Braus Cynthia M
Current Estimated Value
Purchase Details
Closed on
Nov 12, 2009
Sold by
Miller Steven R
Bought by
Federal Home Loan Mortgage Corp
Purchase Details
Closed on
Jun 29, 1998
Sold by
Thompson James R and Thompson Elaine C
Bought by
Miller Steven R
Home Financials for this Owner
Home Financials are based on the most recent Mortgage that was taken out on this home.
Original Mortgage
$60,000
Interest Rate
7.15%
Purchase Details
Closed on
Sep 2, 1993
Sold by
Mcphee Elaine C
Bought by
Thompson Elaine C and Thompson James R
Home Financials for this Owner
Home Financials are based on the most recent Mortgage that was taken out on this home.
Original Mortgage
$24,000
Interest Rate
7.22%
Create a Home Valuation Report for This Property
The Home Valuation Report is an in-depth analysis detailing your home's value as well as a comparison with similar homes in the area
Home Values in the Area
Average Home Value in this Area
Purchase History
| Date | Buyer | Sale Price | Title Company |
|---|---|---|---|
| Braus Cynthia M | $65,500 | Attorneys Title Guaranty Fun | |
| Federal Home Loan Mortgage Corp | -- | None Available | |
| Miller Steven R | $80,000 | Land Title Group Inc | |
| Thompson Elaine C | -- | -- |
Source: Public Records
Mortgage History
| Date | Status | Borrower | Loan Amount |
|---|---|---|---|
| Previous Owner | Miller Steven R | $60,000 | |
| Previous Owner | Thompson Elaine C | $24,000 |
Source: Public Records
Tax History Compared to Growth
Tax History
| Year | Tax Paid | Tax Assessment Tax Assessment Total Assessment is a certain percentage of the fair market value that is determined by local assessors to be the total taxable value of land and additions on the property. | Land | Improvement |
|---|---|---|---|---|
| 2024 | $2,314 | $11,309 | $1,315 | $9,994 |
| 2023 | $2,190 | $11,309 | $1,315 | $9,994 |
| 2022 | $2,190 | $11,309 | $1,315 | $9,994 |
| 2021 | $1,835 | $9,364 | $776 | $8,588 |
| 2020 | $1,898 | $9,364 | $776 | $8,588 |
| 2019 | $1,928 | $10,492 | $776 | $9,716 |
| 2018 | $942 | $6,937 | $717 | $6,220 |
| 2017 | $947 | $6,937 | $717 | $6,220 |
| 2016 | $1,137 | $6,937 | $717 | $6,220 |
| 2015 | $2,261 | $10,302 | $657 | $9,645 |
| 2014 | $2,235 | $10,302 | $657 | $9,645 |
| 2013 | $2,155 | $10,302 | $657 | $9,645 |
Source: Public Records
Map
Nearby Homes
- 2600 Brookwood Way Dr Unit 316
- 2600 Brookwood Way Dr Unit 305
- 2600 Brookwood Way Dr Unit 214
- 2600 Brookwood Unit 314
- 2600 Brookwood Way Dr Unit 212
- 3805 Fairfax Ave
- 1 Foxcroft on Auburn
- 2401 Rohlwing Rd
- 160 E Forest Ln
- 4301 Euclid Ave
- 2041 Vermont St
- 3602 Falcon Ct S
- 3400 Wellington Ct Unit 306
- 3400 Wellington Ct Unit 204
- 2 Croydon on Duxbury
- 4 Eton on Oxford
- 208 Brookdale Ln
- 3355 Kirchoff Rd Unit 6A
- 4512 Kings Walk Dr Unit 1D
- 3275 Kirchoff Rd Unit 337
- 2600 Brookwood Way Dr Unit 313
- 2600 Brookwood Way Dr Unit 114
- 2600 Brookwood Way Dr Unit 105
- 2600 Brookwood Way Dr Unit 311
- 2600 Brookwood Way Dr Unit 308
- 2600 Brookwood Way Dr Unit 102
- 2600 Brookwood Way Dr Unit 314
- 2600 Brookwood Way Dr Unit 113
- 2600 Brookwood Way Dr Unit 312
- 2600 Brookwood Way Dr Unit 315
- 2600 Brookwood Way Dr Unit 304
- 2600 Brookwood Way Dr Unit 211
- 2600 Brookwood Way Dr Unit 208
- 2600 Brookwood Way Dr Unit 206
- 2600 Brookwood Way Dr Unit 204
- 2600 Brookwood Way Dr Unit 201
- 2600 Brookwood Way Dr Unit 115
- 2600 Brookwood Way Dr Unit 112
- 2600 Brookwood Way Dr Unit 310
- 2600 Brookwood Way Dr Unit 209