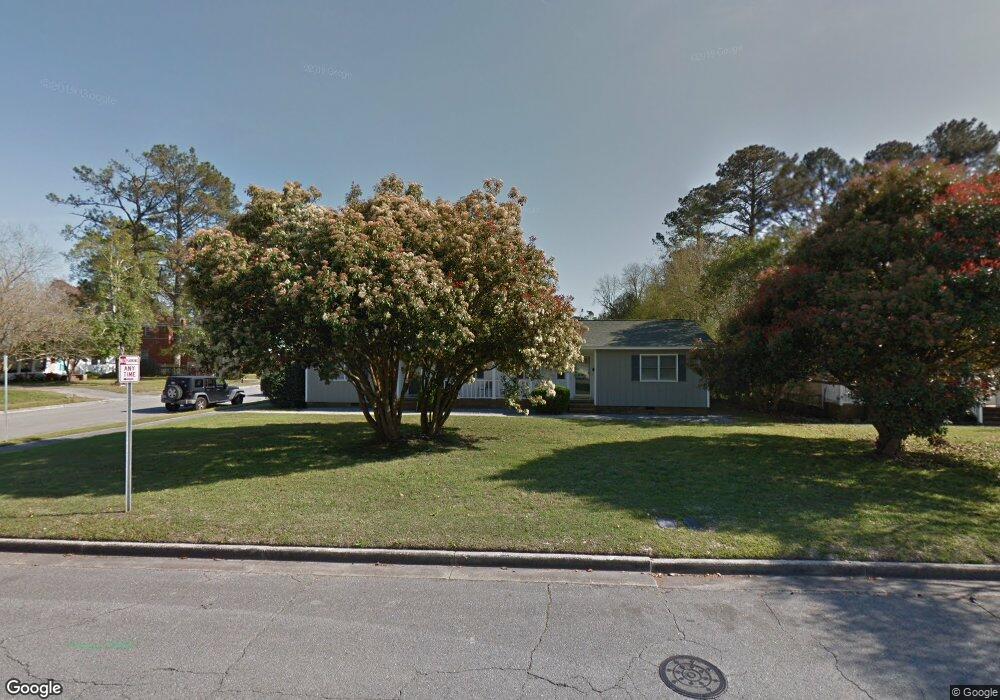
2600 Chestnut St Wilmington, NC 28405
Carolina Heights NeighborhoodEstimated Value: $415,000 - $512,000
4
Beds
2
Baths
1,724
Sq Ft
$264/Sq Ft
Est. Value
About This Home
This home is located at 2600 Chestnut St, Wilmington, NC 28405 and is currently estimated at $454,669, approximately $263 per square foot. 2600 Chestnut St is a home located in New Hanover County with nearby schools including Rachel Freeman School of Engineering, Williston Middle School, and New Hanover High School.
Ownership History
Date
Name
Owned For
Owner Type
Purchase Details
Closed on
Jun 3, 2016
Sold by
Herzog Gerald and Herzog Elaine
Bought by
Herzog Gerald and Herzog Elaine
Current Estimated Value
Purchase Details
Closed on
Mar 27, 2007
Sold by
Morris Bernard J
Bought by
Herzog Gerald and Herzog Elaine
Home Financials for this Owner
Home Financials are based on the most recent Mortgage that was taken out on this home.
Original Mortgage
$148,000
Outstanding Balance
$89,631
Interest Rate
6.27%
Mortgage Type
Unknown
Estimated Equity
$365,038
Purchase Details
Closed on
Mar 14, 2001
Sold by
March Properties Inc
Bought by
Morris Bernard J
Purchase Details
Closed on
Feb 28, 2001
Sold by
Lazenby Helen Howe Robert L
Bought by
March Properties Inc
Purchase Details
Closed on
Jan 1, 1990
Sold by
Norris Helen M
Bought by
Howe Helen M Norris
Purchase Details
Closed on
Jun 1, 1983
Sold by
Yates E W Faye T
Bought by
Plott C L Gail Corbett
Purchase Details
Closed on
Jan 1, 1976
Bought by
Yates E W Faye T
Create a Home Valuation Report for This Property
The Home Valuation Report is an in-depth analysis detailing your home's value as well as a comparison with similar homes in the area
Home Values in the Area
Average Home Value in this Area
Purchase History
| Date | Buyer | Sale Price | Title Company |
|---|---|---|---|
| Herzog Gerald | -- | None Available | |
| Herzog Gerald | $185,000 | None Available | |
| Morris Bernard J | -- | -- | |
| March Properties Inc | $120,000 | -- | |
| Howe Helen M Norris | -- | -- | |
| Plott C L Gail Corbett | $14,000 | -- | |
| Yates E W Faye T | $6,000 | -- |
Source: Public Records
Mortgage History
| Date | Status | Borrower | Loan Amount |
|---|---|---|---|
| Open | Herzog Gerald | $148,000 |
Source: Public Records
Tax History Compared to Growth
Tax History
| Year | Tax Paid | Tax Assessment Tax Assessment Total Assessment is a certain percentage of the fair market value that is determined by local assessors to be the total taxable value of land and additions on the property. | Land | Improvement |
|---|---|---|---|---|
| 2025 | $2,822 | $479,500 | $118,000 | $361,500 |
| 2023 | -- | $0 | $0 | $0 |
| 2022 | $0 | $0 | $0 | $0 |
| 2021 | $13 | $0 | $0 | $0 |
| 2020 | $13 | $1,200 | $1,000 | $200 |
| 2019 | $13 | $188,000 | $40,800 | $147,200 |
| 2018 | $0 | $188,000 | $40,800 | $147,200 |
| 2017 | $1,980 | $188,000 | $40,800 | $147,200 |
| 2016 | $1,507 | $136,000 | $36,000 | $100,000 |
| 2015 | $1,440 | $136,000 | $36,000 | $100,000 |
| 2014 | $1,379 | $136,000 | $36,000 | $100,000 |
Source: Public Records
Map
Nearby Homes
- 102 N 25th St
- 221 N 26th St
- 106 Kenwood Ave
- 2612 Princess Place Dr
- 110 Kenwood Ave
- 6 Keaton Ave
- 115 Forest Hills Dr
- 2906 Market St Unit 202
- 2208 Carlton Ave
- 2401 Westminister Way
- 2024 Market St
- 17 Montgomery Ave
- 418 Forest Hills Dr
- 2020 Princess Place Dr
- 2117 Plaza Dr
- 2119 Metts Ave
- 1908 Princess St
- 222 Evans St
- 2220 Gibson Ave
- 115 Covil Ave Unit 102