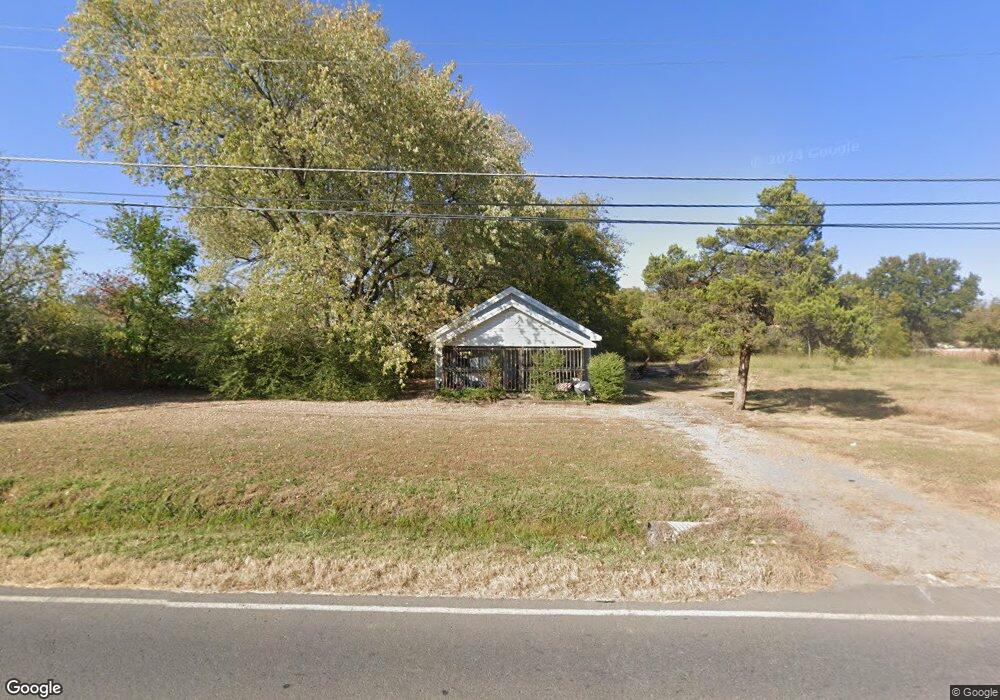
2600 E Hancock St Muskogee, OK 74403
Phoenix Village NeighborhoodEstimated Value: $79,000 - $107,000
2
Beds
1
Bath
960
Sq Ft
$100/Sq Ft
Est. Value
About This Home
This home is located at 2600 E Hancock St, Muskogee, OK 74403 and is currently estimated at $95,559, approximately $99 per square foot. 2600 E Hancock St is a home located in Muskogee County with nearby schools including 6th Grade Academy, 8th & 9th Grade Academy @ Alice Robertson, and Muskogee High School.
Ownership History
Date
Name
Owned For
Owner Type
Purchase Details
Closed on
Oct 3, 2008
Sold by
Secretary Of Hud
Bought by
Cartwright Jack Ed
Current Estimated Value
Home Financials for this Owner
Home Financials are based on the most recent Mortgage that was taken out on this home.
Original Mortgage
$50,000
Interest Rate
6.35%
Mortgage Type
New Conventional
Purchase Details
Closed on
Jan 3, 2008
Sold by
Doe Jane and Fain Ralph Perry
Bought by
Us Bank Na
Purchase Details
Closed on
Nov 21, 2005
Sold by
West Gerald J and West Cherry J
Bought by
Lanier Lee
Home Financials for this Owner
Home Financials are based on the most recent Mortgage that was taken out on this home.
Original Mortgage
$52,257
Interest Rate
6.06%
Mortgage Type
FHA
Purchase Details
Closed on
Oct 4, 2002
Purchase Details
Closed on
Apr 20, 1995
Purchase Details
Closed on
Nov 1, 1991
Create a Home Valuation Report for This Property
The Home Valuation Report is an in-depth analysis detailing your home's value as well as a comparison with similar homes in the area
Home Values in the Area
Average Home Value in this Area
Purchase History
| Date | Buyer | Sale Price | Title Company |
|---|---|---|---|
| Cartwright Jack Ed | -- | None Available | |
| Us Bank Na | $51,546 | None Available | |
| Lanier Lee | $53,000 | None Available | |
| -- | $62,000 | -- | |
| -- | -- | -- | |
| -- | $6,500 | -- | |
| -- | -- | -- |
Source: Public Records
Mortgage History
| Date | Status | Borrower | Loan Amount |
|---|---|---|---|
| Closed | Cartwright Jack Ed | $50,000 | |
| Previous Owner | Lanier Lee | $52,257 |
Source: Public Records
Tax History Compared to Growth
Tax History
| Year | Tax Paid | Tax Assessment Tax Assessment Total Assessment is a certain percentage of the fair market value that is determined by local assessors to be the total taxable value of land and additions on the property. | Land | Improvement |
|---|---|---|---|---|
| 2024 | $231 | $2,116 | $686 | $1,430 |
| 2023 | $231 | $2,016 | $644 | $1,372 |
| 2022 | $201 | $2,016 | $644 | $1,372 |
| 2021 | $371 | $3,710 | $644 | $3,066 |
| 2020 | $372 | $3,710 | $644 | $3,066 |
| 2019 | $369 | $3,711 | $644 | $3,067 |
| 2018 | $349 | $3,711 | $644 | $3,067 |
| 2017 | $322 | $3,412 | $644 | $2,768 |
| 2016 | $325 | $3,412 | $644 | $2,768 |
| 2015 | $322 | $3,412 | $644 | $2,768 |
| 2014 | $323 | $3,362 | $644 | $2,718 |
Source: Public Records
Map
Nearby Homes
- 2613 Turner St
- 901 S Anthony St
- 2802 Georgia Ave
- 2509 Canterbury Ave
- 614 Hilltop Ln
- 2430 S 31st St E
- 2902 Hilltop Ave
- 0 Burbank St
- 609 Foltz Ln
- 3000 Canterbury Ave
- 311 Gawf Rd
- 2548 Tull Place
- 501 S Bacone St
- 0 S York St
- 2900 S 28th St E
- 2815 Monta Place
- 0 Indiana St
- 303 Gawf Ln
- 201 S Camden St
- 1113 Illinois St
- 2533 E Hancock St
- 1215 Foxcroft Cir
- 2509 Turner St
- 3034 N Sooner Ave
- 2521 E Hancock St
- 2507 Turner St
- 2603 Turner St
- 2601 Turner St
- 2401 E Hancock St
- 2510 Turner St
- 2605 Turner St
- 1005 S Bacone St
- 2607 Turner St
- 2600 Turner St
- 2609 Turner St
- 1003 S Bacone St
- 2602 Turner St
- 2604 Turner St
- 2611 Turner St
- 3009 E Hancock St