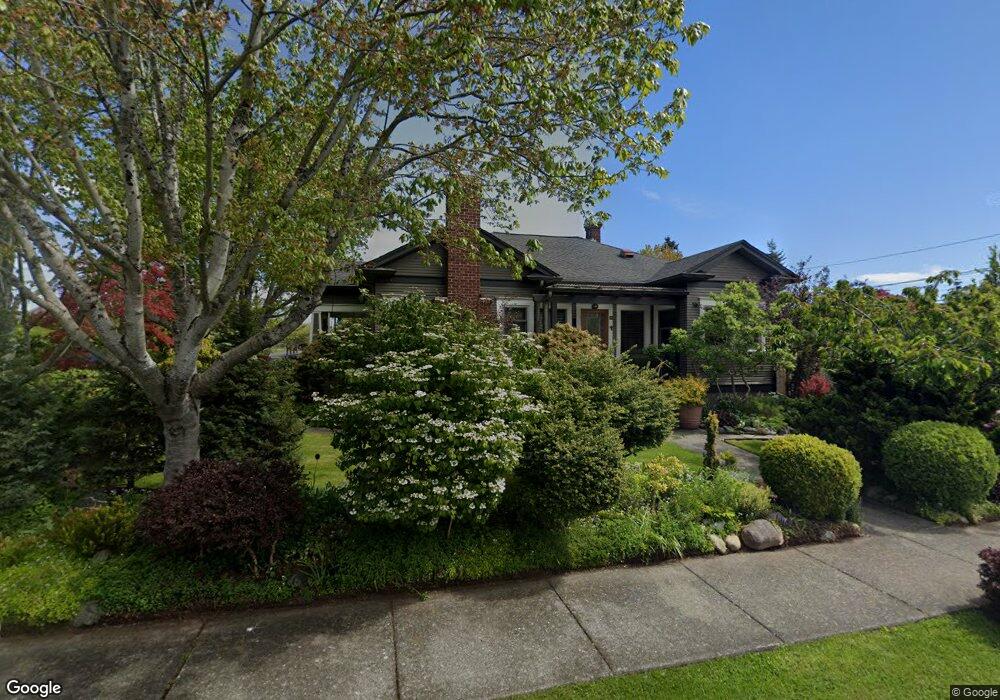
2600 G St Bellingham, WA 98225
Lettered Streets NeighborhoodEstimated Value: $690,000 - $873,205
2
Beds
1
Bath
1,258
Sq Ft
$625/Sq Ft
Est. Value
About This Home
This home is located at 2600 G St, Bellingham, WA 98225 and is currently estimated at $786,301, approximately $625 per square foot. 2600 G St is a home located in Whatcom County with nearby schools including Parkview Elementary School, Whatcom Middle School, and Bellingham High School.
Ownership History
Date
Name
Owned For
Owner Type
Purchase Details
Closed on
Jan 12, 2017
Sold by
Bowle David L
Bought by
Morton Christine
Current Estimated Value
Purchase Details
Closed on
Sep 12, 2006
Sold by
Soriano Dorothy A
Bought by
Bowie David L and Morton Christine
Home Financials for this Owner
Home Financials are based on the most recent Mortgage that was taken out on this home.
Original Mortgage
$239,200
Interest Rate
6.1%
Mortgage Type
Unknown
Purchase Details
Closed on
Jul 15, 2004
Sold by
Walker Brent L and Walker Cherie T
Bought by
Soriano Dorothy A
Purchase Details
Closed on
Feb 22, 2002
Sold by
Grimm Terry T
Bought by
Walker Brent L and Walker Cherie T
Create a Home Valuation Report for This Property
The Home Valuation Report is an in-depth analysis detailing your home's value as well as a comparison with similar homes in the area
Home Values in the Area
Average Home Value in this Area
Purchase History
| Date | Buyer | Sale Price | Title Company |
|---|---|---|---|
| Morton Christine | $320,499 | None Available | |
| Bowie David L | $299,280 | Stewart Title Company | |
| Soriano Dorothy A | $252,000 | Stewart Title Company | |
| Walker Brent L | -- | First American Title Insuran |
Source: Public Records
Mortgage History
| Date | Status | Borrower | Loan Amount |
|---|---|---|---|
| Previous Owner | Bowie David L | $239,200 |
Source: Public Records
Tax History Compared to Growth
Tax History
| Year | Tax Paid | Tax Assessment Tax Assessment Total Assessment is a certain percentage of the fair market value that is determined by local assessors to be the total taxable value of land and additions on the property. | Land | Improvement |
|---|---|---|---|---|
| 2024 | $6,189 | $775,641 | $300,183 | $475,458 |
| 2023 | $6,189 | $795,342 | $307,808 | $487,534 |
| 2022 | $5,055 | $685,651 | $265,356 | $420,295 |
| 2021 | $4,959 | $544,168 | $210,600 | $333,568 |
| 2020 | $4,683 | $503,859 | $195,000 | $308,859 |
| 2019 | $4,193 | $459,950 | $166,370 | $293,580 |
| 2018 | $4,222 | $412,866 | $149,370 | $263,496 |
| 2017 | $3,643 | $355,465 | $128,600 | $226,865 |
| 2016 | $3,187 | $320,499 | $115,400 | $205,099 |
| 2015 | $3,125 | $291,918 | $105,400 | $186,518 |
| 2014 | -- | $276,962 | $100,000 | $176,962 |
| 2013 | -- | $267,601 | $73,500 | $194,101 |
Source: Public Records
Map
Nearby Homes