
Seller's Agent in 2025
Joni Wenger
John L Scott
2 in this area
2 Total Sales

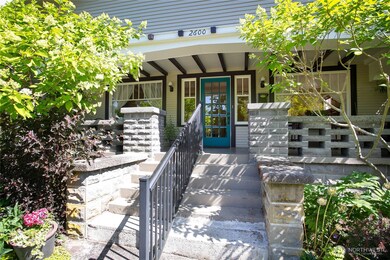
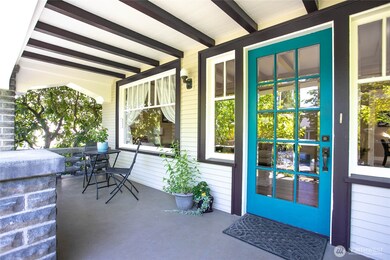
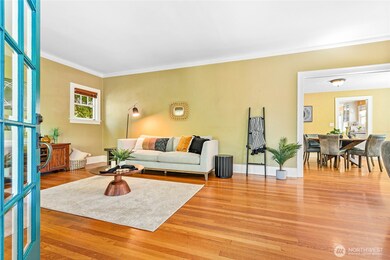
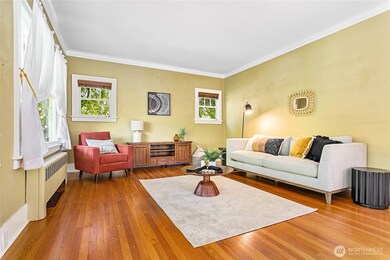
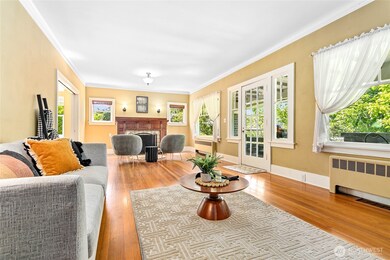
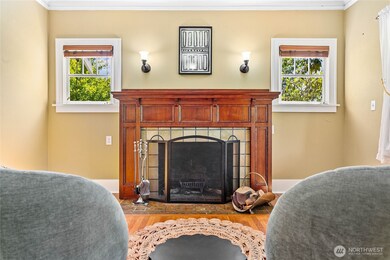
This charming corner lot home is ideally located at the edge of the sought-after Lettered Streets and Cornwall Park neighborhoods. The upper level boasts a spacious porch, two cozy bedrooms, and a full bathroom. There are beautiful hardwood floors and a wood-burning fireplace. The kitchen is filled with natural light and opens to a back deck that overlooks meticulously maintained gardens and a greenhouse. Downstairs you'll find a generous workshop with a stove. The space is accessible via the carport, allowing for easy access with two large doors. The lower level also includes an additional bedroom, a large bonus room, a custom remodeled bathroom, and wine cellar. Also potential for conversion to apartment-in-law with separate access.
Last Agent to Sell the Property
John L. Scott Bellingham License #25003981 Listed on: 07/01/2025
Source: Northwest Multiple Listing Service (NWMLS)
MLS#: 2401392
| Date | Type | Sale Price | Title Company |
|---|---|---|---|
| Warranty Deed | $880,000 | Chicago Title | |
| Warranty Deed | $405,280 | Whatcom Land Title | |
| Warranty Deed | $279,000 | Stewart Title Company |
| Date | Status | Loan Amount | Loan Type |
|---|---|---|---|
| Previous Owner | $324,000 | Unknown | |
| Previous Owner | $223,200 | Fannie Mae Freddie Mac |
| Date | Event | Price | List to Sale | Price per Sq Ft |
|---|---|---|---|---|
| 08/26/2025 08/26/25 | Sold | $880,000 | -2.2% | $475 / Sq Ft |
| 08/12/2025 08/12/25 | Pending | -- | -- | -- |
| 08/07/2025 08/07/25 | Price Changed | $899,999 | -2.7% | $486 / Sq Ft |
| 07/01/2025 07/01/25 | For Sale | $925,000 | -- | $499 / Sq Ft |
| Year | Tax Paid | Tax Assessment Tax Assessment Total Assessment is a certain percentage of the fair market value that is determined by local assessors to be the total taxable value of land and additions on the property. | Land | Improvement |
|---|---|---|---|---|
| 2024 | $6,921 | $867,430 | $307,880 | $559,550 |
| 2023 | $6,921 | $889,463 | $315,700 | $573,763 |
| 2022 | $5,653 | $766,792 | $272,160 | $494,632 |
| 2021 | $5,546 | $608,565 | $216,000 | $392,565 |
| 2020 | $5,506 | $563,486 | $200,000 | $363,486 |
| 2019 | $4,930 | $540,767 | $158,052 | $382,715 |
| 2018 | $4,964 | $485,399 | $141,902 | $343,497 |
| 2017 | $4,285 | $417,915 | $122,170 | $295,745 |
| 2016 | $3,748 | $377,000 | $109,630 | $267,370 |
| 2015 | $3,675 | $343,277 | $100,130 | $243,147 |
| 2014 | -- | $325,690 | $95,000 | $230,690 |
| 2013 | -- | $293,469 | $73,500 | $219,969 |
Seller's Agent in 2025
Joni Wenger
John L Scott
2 in this area
2 Total Sales
Buyer's Agent in 2025
Gordon Neufeld
Muljat Group
(360) 393-8299
1 in this area
131 Total Sales
Source: Northwest Multiple Listing Service (NWMLS)
MLS Number: 2401392
APN: 380319-208113-0000
Disclaimer: Certain information contained herein is derived from information provided by parties other than Homes.com. All information provided is deemed reliable, but is not guaranteed to be accurate and should be independently verified.
![]() All data is obtained from various sources and may not have been verified by broker or MLS GRID. Supplied Open House Information is subject to change without notice. All information should be independently reviewed and verified for accuracy. Properties may or may not be listed by the office/agent presenting the information. Listing information is provided by the Northwest Multiple Listing Service (NWMLS). Property information is based on available data that may include MLS information, county records, and other sources. Listings marked with the 3 tree icon and provided by NWMLS. All properties are subject to prior sale or withdrawal. IDX information is provided exclusively for consumers’ personal noncommercial use, that it may not be used for any purpose other than to identify prospective properties consumers may be interested in purchasing, that the data is deemed reliable but is not guaranteed by MLS GRID. ©2025 NWMLS.
All data is obtained from various sources and may not have been verified by broker or MLS GRID. Supplied Open House Information is subject to change without notice. All information should be independently reviewed and verified for accuracy. Properties may or may not be listed by the office/agent presenting the information. Listing information is provided by the Northwest Multiple Listing Service (NWMLS). Property information is based on available data that may include MLS information, county records, and other sources. Listings marked with the 3 tree icon and provided by NWMLS. All properties are subject to prior sale or withdrawal. IDX information is provided exclusively for consumers’ personal noncommercial use, that it may not be used for any purpose other than to identify prospective properties consumers may be interested in purchasing, that the data is deemed reliable but is not guaranteed by MLS GRID. ©2025 NWMLS.
Based on information submitted to the MLS GRID