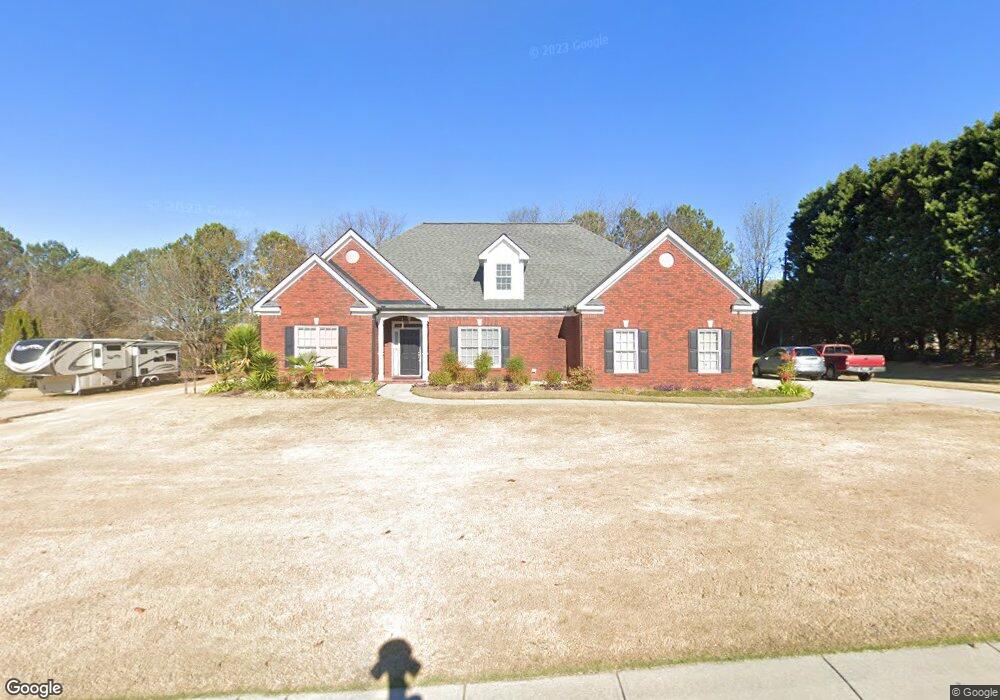
2600 Harbin Springs Cove Dacula, GA 30019
Estimated Value: $382,000 - $406,000
3
Beds
3
Baths
1,964
Sq Ft
$201/Sq Ft
Est. Value
About This Home
This home is located at 2600 Harbin Springs Cove, Dacula, GA 30019 and is currently estimated at $395,439, approximately $201 per square foot. 2600 Harbin Springs Cove is a home located in Gwinnett County with nearby schools including Harbins Elementary School, McConnell Middle School, and Archer High School.
Ownership History
Date
Name
Owned For
Owner Type
Purchase Details
Closed on
Apr 7, 2022
Sold by
Her Xia Seng
Bought by
Her Xia Seng and Her Michael
Current Estimated Value
Purchase Details
Closed on
Mar 23, 2010
Sold by
Her Geu V
Bought by
Her Xia S
Purchase Details
Closed on
Nov 16, 2001
Sold by
Harvin Gary and Harvin Stephanie
Bought by
Her Xia S and Her Geu V
Home Financials for this Owner
Home Financials are based on the most recent Mortgage that was taken out on this home.
Original Mortgage
$100,000
Interest Rate
6.07%
Mortgage Type
New Conventional
Purchase Details
Closed on
Mar 14, 2001
Sold by
Heard Homes
Bought by
Harvin Gary and Harvin Stephanie
Home Financials for this Owner
Home Financials are based on the most recent Mortgage that was taken out on this home.
Original Mortgage
$128,000
Interest Rate
7.02%
Mortgage Type
New Conventional
Create a Home Valuation Report for This Property
The Home Valuation Report is an in-depth analysis detailing your home's value as well as a comparison with similar homes in the area
Home Values in the Area
Average Home Value in this Area
Purchase History
| Date | Buyer | Sale Price | Title Company |
|---|---|---|---|
| Her Xia Seng | -- | -- | |
| Her Xia S | -- | -- | |
| Her Xia S | $169,000 | -- | |
| Harvin Gary | $160,000 | -- |
Source: Public Records
Mortgage History
| Date | Status | Borrower | Loan Amount |
|---|---|---|---|
| Previous Owner | Her Xia S | $100,000 | |
| Previous Owner | Harvin Gary | $128,000 |
Source: Public Records
Tax History Compared to Growth
Tax History
| Year | Tax Paid | Tax Assessment Tax Assessment Total Assessment is a certain percentage of the fair market value that is determined by local assessors to be the total taxable value of land and additions on the property. | Land | Improvement |
|---|---|---|---|---|
| 2025 | $1,176 | $137,240 | $30,000 | $107,240 |
| 2024 | $1,165 | $129,480 | $30,000 | $99,480 |
| 2023 | $1,165 | $136,640 | $32,000 | $104,640 |
| 2022 | $1,121 | $108,920 | $26,000 | $82,920 |
| 2021 | $1,100 | $103,280 | $22,400 | $80,880 |
| 2020 | $1,098 | $88,680 | $19,200 | $69,480 |
| 2019 | $1,018 | $88,680 | $19,200 | $69,480 |
| 2018 | $2,695 | $78,920 | $19,200 | $59,720 |
| 2016 | $2,450 | $66,600 | $13,600 | $53,000 |
| 2015 | $2,323 | $60,080 | $9,200 | $50,880 |
| 2014 | $2,334 | $60,080 | $9,200 | $50,880 |
Source: Public Records
Map
Nearby Homes
- 2650 Harbins Mill Dr
- 1734 Will Wages Rd
- 1432 Armende Cir
- 2430 Harbin Springs Cove
- 2760 Jona Trail
- 2630 Track Way
- 1476 Rolling View Way
- 1845 Country Crest Way
- 1401 Barimore Ct
- 3216 Morris Hills Dr
- 1365 Slate Bend Dr
- 1354 Slate Bend Dr
- 1314 Bentley Estates Dr
- 0 Luke Edwards Rd Unit 20134058
- 0 Luke Edwards Rd Unit 10307117
- 0 Luke Edwards Rd Unit 7393448
- 2301 Brooks Rd
- 1151 Paiute Ct
- 2590 Harbin Springs Cove
- 2605 Harbin Springs Cove Unit 1
- 2605 Harbin Springs Cove
- 2635 Harbins Mill Dr
- 2595 Harbin Springs Cove
- 1654 Will Wages Rd
- 2580 Harbin Springs Cove
- 2645 Harbins Mill Dr
- 2625 Harbins Mill Dr
- 2655 Harbins Mill Dr
- 2585 Harbin Springs Cove
- 2600 Little Fox Dr
- 2615 Harbins Mill Dr
- 2570 Harbin Springs Cove
- 0 Harbins Mill Dr Unit 8516640
- 0 Harbins Mill Dr Unit 8117625
- 0 Harbins Mill Dr Unit 8093787
- 0 Harbins Mill Dr Unit 7550428
- 0 Harbins Mill Dr Unit 7537879
- 0 Harbins Mill Dr Unit 3147304